快速开始#
如果你是 Feature-engine 的新手,本指南将帮助你入门。Feature-engine 转换器具有 fit() 和 transform() 方法,用于从数据中学习参数并随后修改数据。它们的工作方式与任何 Scikit-learn 转换器一样。
安装#
Feature-engine 是一个 Python 3 包,并且与 3.7 或更高版本兼容。早期版本与最新的 Python 数值计算库不兼容。
$ pip install feature-engine
注意,你也可以用以下方式安装它:
$ pip install feature_engine
请注意,Feature-engine 是一个活跃的项目,并且定期发布新版本。为了将 Feature-engine 升级到最新版本,请使用 pip 如下操作。
$ pip install -U feature-engine
如果你使用的是 Anaconda,你可以安装 Anaconda Feature-engine 包:
$ conda install -c conda-forge feature_engine
安装完成后,您应该能够在 Python 和 Jupyter 笔记本中导入 Feature-engine 而不会出现错误。
示例用法#
这是一个使用 Feature-engine 的转换器进行缺失数据插补的示例。
import numpy as np
import pandas as pd
import matplotlib.pyplot as plt
from sklearn.model_selection import train_test_split

from feature_engine.imputation import MeanMedianImputer

# Load dataset
data = pd.read_csv('houseprice.csv')

# Separate into train and test sets
X_train, X_test, y_train, y_test = train_test_split(
    data.drop(['Id', 'SalePrice'], axis=1),
    data['SalePrice'],
    test_size=0.3,
    random_state=0
)

# set up the imputer
median_imputer = MeanMedianImputer(
    imputation_method='median', variables=['LotFrontage', 'MasVnrArea']
    )

# fit the imputer
median_imputer.fit(X_train)

# transform the data
train_t = median_imputer.transform(X_train)
test_t = median_imputer.transform(X_test)

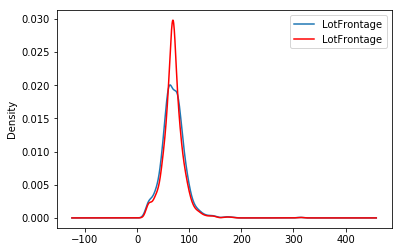
fig = plt.figure()
ax = fig.add_subplot(111)
X_train['LotFrontage'].plot(kind='kde', ax=ax)
train_t['LotFrontage'].plot(kind='kde', ax=ax, color='red')
lines, labels = ax.get_legend_handles_labels()
ax.legend(lines, labels, loc='best')

使用 Scikit-learn 管道的 Feature-engine#
Feature-engine 的转换器可以在 Scikit-learn 管道中组装。这样,我们可以将整个特征工程管道存储在一个对象或 pickle (.pkl) 中。以下是如何做到这一点的一个示例:
from math import sqrt
import pandas as pd
import numpy as np
import matplotlib.pyplot as plt

from sklearn.linear_model import Lasso
from sklearn.metrics import mean_squared_error
from sklearn.model_selection import train_test_split
from sklearn.pipeline import Pipeline as pipe
from sklearn.preprocessing import MinMaxScaler

from feature_engine.encoding import RareLabelEncoder, MeanEncoder
from feature_engine.discretisation import DecisionTreeDiscretiser
from feature_engine.imputation import (
    AddMissingIndicator,
    MeanMedianImputer,
    CategoricalImputer,
)

# load dataset
data = pd.read_csv('houseprice.csv')

# drop some variables
data.drop(
    labels=['YearBuilt', 'YearRemodAdd', 'GarageYrBlt', 'Id'],
    axis=1,
    inplace=True
)

# make a list of categorical variables
categorical = [var for var in data.columns if data[var].dtype == 'O']

# make a list of numerical variables
numerical = [var for var in data.columns if data[var].dtype != 'O']

# make a list of discrete variables
discrete = [ var for var in numerical if len(data[var].unique()) < 20]

# categorical encoders work only with object type variables
# to treat numerical variables as categorical, we need to re-cast them
data[discrete]= data[discrete].astype('O')

# continuous variables
numerical = [
    var for var in numerical if var not in discrete
    and var not in ['Id', 'SalePrice']
    ]

# separate into train and test sets
X_train, X_test, y_train, y_test = train_test_split(
                                        data.drop(labels=['SalePrice'], axis=1),
                                        data.SalePrice,
                                        test_size=0.1,
                                        random_state=0
                                        )

# set up the pipeline
price_pipe = pipe([
    # add a binary variable to indicate missing information for the 2 variables below
    ('continuous_var_imputer', AddMissingIndicator(variables=['LotFrontage'])),

    # replace NA by the median in the 2 variables below, they are numerical
    ('continuous_var_median_imputer', MeanMedianImputer(
        imputation_method='median', variables=['LotFrontage', 'MasVnrArea']
    )),

    # replace NA by adding the label "Missing" in categorical variables
    ('categorical_imputer', CategoricalImputer(variables=categorical)),

    # disretise continuous variables using trees
    ('numerical_tree_discretiser', DecisionTreeDiscretiser(
        cv=3,
        scoring='neg_mean_squared_error',
        variables=numerical,
        regression=True)),

    # remove rare labels in categorical and discrete variables
    ('rare_label_encoder', RareLabelEncoder(
        tol=0.03, n_categories=1, variables=categorical+discrete
    )),

    # encode categorical and discrete variables using the target mean
    ('categorical_encoder', MeanEncoder(variables=categorical+discrete)),

    # scale features
    ('scaler', MinMaxScaler()),

    # Lasso
    ('lasso', Lasso(random_state=2909, alpha=0.005))

])

# train feature engineering transformers and Lasso
price_pipe.fit(X_train, np.log(y_train))

# predict
pred_train = price_pipe.predict(X_train)
pred_test = price_pipe.predict(X_test)

# Evaluate
print('Lasso Linear Model train mse: {}'.format(
    mean_squared_error(y_train, np.exp(pred_train))))
print('Lasso Linear Model train rmse: {}'.format(
    sqrt(mean_squared_error(y_train, np.exp(pred_train)))))
print()
print('Lasso Linear Model test mse: {}'.format(
    mean_squared_error(y_test, np.exp(pred_test))))
print('Lasso Linear Model test rmse: {}'.format(
    sqrt(mean_squared_error(y_test, np.exp(pred_test)))))
Lasso Linear Model train mse: 949189263.8948538
Lasso Linear Model train rmse: 30808.9153313591

Lasso Linear Model test mse: 1344649485.0641894
Lasso Linear Model train rmse: 36669.46256852136
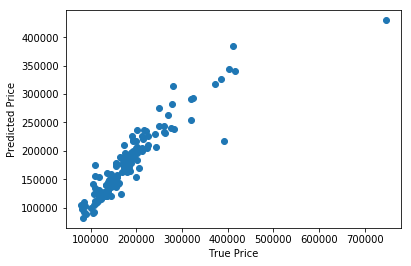
plt.scatter(y_test, np.exp(pred_test))
plt.xlabel('True Price')
plt.ylabel('Predicted Price')
plt.show()

