Note
Go to the end to download the full example code.
基本 matplotlib#
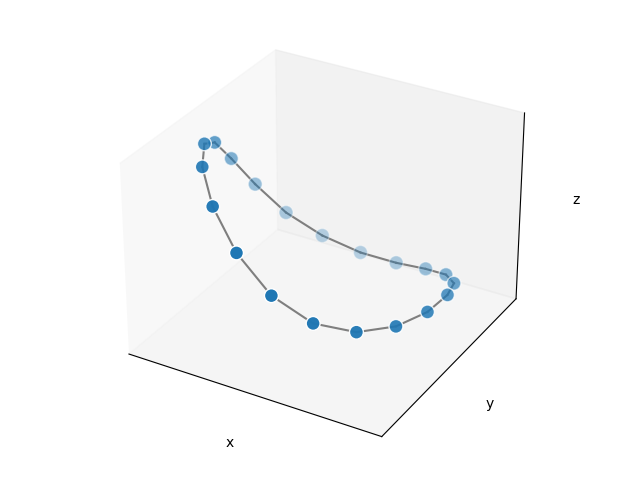
使用 mpl_toolkits.mplot_3d 进行3D图形可视化的基本示例。

import networkx as nx
import numpy as np
import matplotlib.pyplot as plt
from mpl_toolkits.mplot3d import Axes3D

# 要可视化的图表
G = nx.cycle_graph(20)

# 三维弹簧布局
pos = nx.spring_layout(G, dim=3, seed=779)
# 从布局中提取节点和边缘位置
node_xyz = np.array([pos[v] for v in sorted(G)])
edge_xyz = np.array([(pos[u], pos[v]) for u, v in G.edges()])

# 创建3D图形
fig = plt.figure()
ax = fig.add_subplot(111, projection="3d")

# 绘制节点 - alpha 值会根据“深度”自动调整
ax.scatter(*node_xyz.T, s=100, ec="w")

# 绘制边缘
for vizedge in edge_xyz:
    ax.plot(*vizedge.T, color="tab:gray")


def _format_axes(ax):
    """三维坐标轴的可视化选项。"""
    # 关闭网格线
    ax.grid(False)
    # 抑制刻度标签
    for dim in (ax.xaxis, ax.yaxis, ax.zaxis):
        dim.set_ticks([])
    # 设置坐标轴标签
    ax.set_xlabel("x")
    ax.set_ylabel("y")
    ax.set_zlabel("z")


_format_axes(ax)
fig.tight_layout()
plt.show()
Total running time of the script: (0 minutes 0.034 seconds)
