Note
Go to the end to download the full example code.
读取和写入图。#

(0, 0) (1, 0) (0, 1)
(0, 1) (1, 1) (0, 2)
(0, 2) (1, 2) (0, 3)
(0, 3) (1, 3) (0, 4)
(0, 4) (1, 4)
(1, 0) (2, 0) (1, 1)
(1, 1) (2, 1) (1, 2)
(1, 2) (2, 2) (1, 3)
(1, 3) (2, 3) (1, 4)
(1, 4) (2, 4)
(2, 0) (3, 0) (2, 1)
(2, 1) (3, 1) (2, 2)
(2, 2) (3, 2) (2, 3)
(2, 3) (3, 3) (2, 4)
(2, 4) (3, 4)
(3, 0) (4, 0) (3, 1)
(3, 1) (4, 1) (3, 2)
(3, 2) (4, 2) (3, 3)
(3, 3) (4, 3) (3, 4)
(3, 4) (4, 4)
(4, 0) (4, 1)
(4, 1) (4, 2)
(4, 2) (4, 3)
(4, 3) (4, 4)
(4, 4)
import matplotlib.pyplot as plt
import networkx as nx

G = nx.grid_2d_graph(5, 5)  # 5x5 grid

# 打印邻接表
for line in nx.generate_adjlist(G):
    print(line)
# 将边列表写入 grid.edgelist
nx.write_edgelist(G, path="grid.edgelist", delimiter=":")
# 从grid.edgelist读取边列表
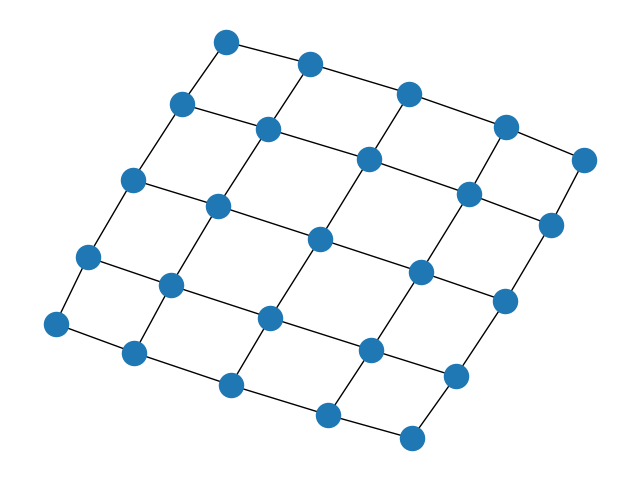
H = nx.read_edgelist(path="grid.edgelist", delimiter=":")

pos = nx.spring_layout(H, seed=200)
nx.draw(H, pos)
plt.show()
Total running time of the script: (0 minutes 0.039 seconds)