Note
Go to the end to download the full example code.
Knuth Miles#
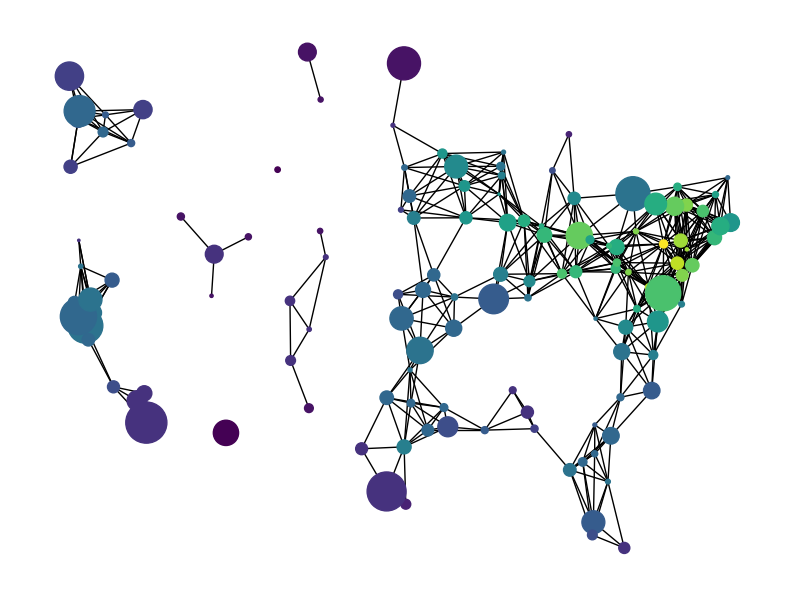
miles_graph() 返回一个包含128个美国城市的无向图。每个城市都有位置和人口数据。边上标注了两个城市之间的距离。
这个例子在以下章节中描述:
唐纳德·E·克努特 (Donald E. Knuth),《斯坦福图基:组合计算平台》(The Stanford GraphBase: A Platform for Combinatorial Computing),ACM出版社,纽约,1993年。 http://www-cs-faculty.stanford.edu/~knuth/sgb.html
数据文件可以在以下链接找到:

Loaded miles_dat.txt containing 128 cities.
Graph with 128 nodes and 8128 edges
import gzip
import re

# 忽略与使用cartopy下载shp文件相关的任何警告
import warnings

warnings.simplefilter("ignore")

import numpy as np
import matplotlib.pyplot as plt
import networkx as nx


def miles_graph():
    """返回Stanford GraphBase中的miles_dat.txt文件中的城市示例图。
"""
    # 打开文件 miles_dat.txt.gz(或 miles_dat.txt)

    fh = gzip.open("knuth_miles.txt.gz", "r")

    G = nx.Graph()
    G.position = {}
    G.population = {}

    cities = []
    for line in fh.readlines():
        line = line.decode()
        if line.startswith("*"):  # 跳过注释
            continue

        numfind = re.compile(r"^\d+")

        if numfind.match(line):  # 这一行是距离
            dist = line.split()
            for d in dist:
                G.add_edge(city, cities[i], weight=int(d))
                i = i + 1
        else:  # 这条线表示一个城市,位置,人口
            i = 1
            (city, coordpop) = line.split("[")
            cities.insert(0, city)
            (coord, pop) = coordpop.split("]")
            (y, x) = coord.split(",")

            G.add_node(city)
            # 分配位置 - 将字符串转换为经纬度
            G.position[city] = (-float(x) / 100, float(y) / 100)
            G.population[city] = float(pop) / 1000
    return G


G = miles_graph()

print("Loaded miles_dat.txt containing 128 cities.")
print(G)

# 创建一个新的城市图,如果两个城市之间的距离小于300英里,则它们之间有边连接
H = nx.Graph()
for v in G:
    H.add_node(v)
for u, v, d in G.edges(data=True):
    if d["weight"] < 300:
        H.add_edge(u, v)

# 使用matplotlib/pylab绘图
fig = plt.figure(figsize=(8, 6))

# 节点按度数着色,按人口大小调整尺寸
node_color = [float(H.degree(v)) for v in H]

# 使用cartopy为可视化提供背景
try:
    import cartopy.crs as ccrs
    import cartopy.io.shapereader as shpreader

    ax = fig.add_axes([0, 0, 1, 1], projection=ccrs.LambertConformal(), frameon=False)
    ax.set_extent([-125, -66.5, 20, 50], ccrs.Geodetic())
    # 添加国家及美国各州的背景地图
    for shapename in ("admin_1_states_provinces_lakes_shp", "admin_0_countries"):
        shp = shpreader.natural_earth(
            resolution="110m", category="cultural", name=shapename
        )
        ax.add_geometries(
            shpreader.Reader(shp).geometries(),
            ccrs.PlateCarree(),
            facecolor="none",
            edgecolor="k",
        )
    # 注意:当使用cartopy时,直接使用matplotlib而不是nx.draw
    # 利用cartopy的变换功能
    ax.scatter(
        *np.array(list(G.position.values())).T,
        s=[G.population[v] for v in H],
        c=node_color,
        transform=ccrs.PlateCarree(),
        zorder=100,  # 确保节点位于边线/状态线的上方
    )
    # 绘制城市之间的边
    for edge in H.edges():
        edge_coords = np.array([G.position[v] for v in edge])
        ax.plot(
            edge_coords[:, 0],
            edge_coords[:, 1],
            transform=ccrs.PlateCarree(),
            linewidth=0.75,
            color="k",
        )

except ImportError:
    # 如果cartopy不可用,绘图的背景将为空白;
    # 尽管如此,你仍然应该能够辨别出美国的大致形状
    # 从图节点和边中!
    nx.draw(
        H,
        G.position,
        node_size=[G.population[v] for v in H],
        node_color=node_color,
        with_labels=False,
    )

plt.show()
Total running time of the script: (0 minutes 0.046 seconds)