Note
Go to the end to download the full example code.
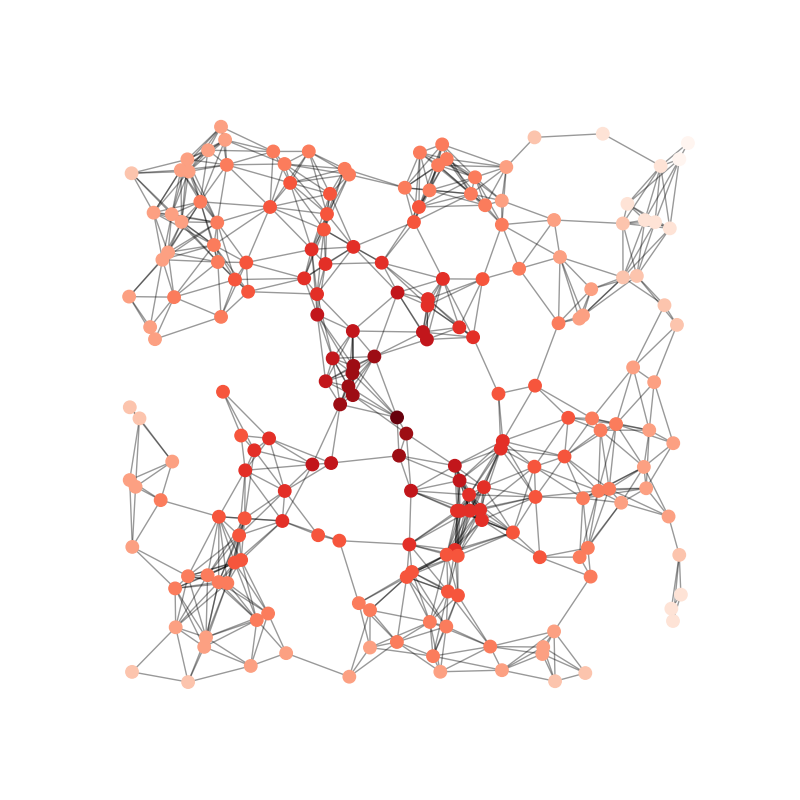
随机几何图#
示例

import matplotlib.pyplot as plt
import networkx as nx

# 创建图表时使用种子以确保可重复性
G = nx.random_geometric_graph(200, 0.125, seed=896803)
# 位置作为节点属性数据存储在random_geometric_graph中
pos = nx.get_node_attributes(G, "pos")

# 找到靠近中心(0.5,0.5)的节点
dmin = 1
ncenter = 0
for n in pos:
    x, y = pos[n]
    d = (x - 0.5) ** 2 + (y - 0.5) ** 2
    if d < dmin:
        ncenter = n
        dmin = d

# 根据接近中心节点的路径长度着色
p = dict(nx.single_source_shortest_path_length(G, ncenter))

plt.figure(figsize=(8, 8))
nx.draw_networkx_edges(G, pos, alpha=0.4)
nx.draw_networkx_nodes(
    G,
    pos,
    nodelist=list(p.keys()),
    node_size=80,
    node_color=list(p.values()),
    cmap=plt.cm.Reds_r,
)

plt.xlim(-0.05, 1.05)
plt.ylim(-0.05, 1.05)
plt.axis("off")
plt.show()
Total running time of the script: (0 minutes 0.046 seconds)