Note
Go to the end to download the full example code.
从一组线构建图#
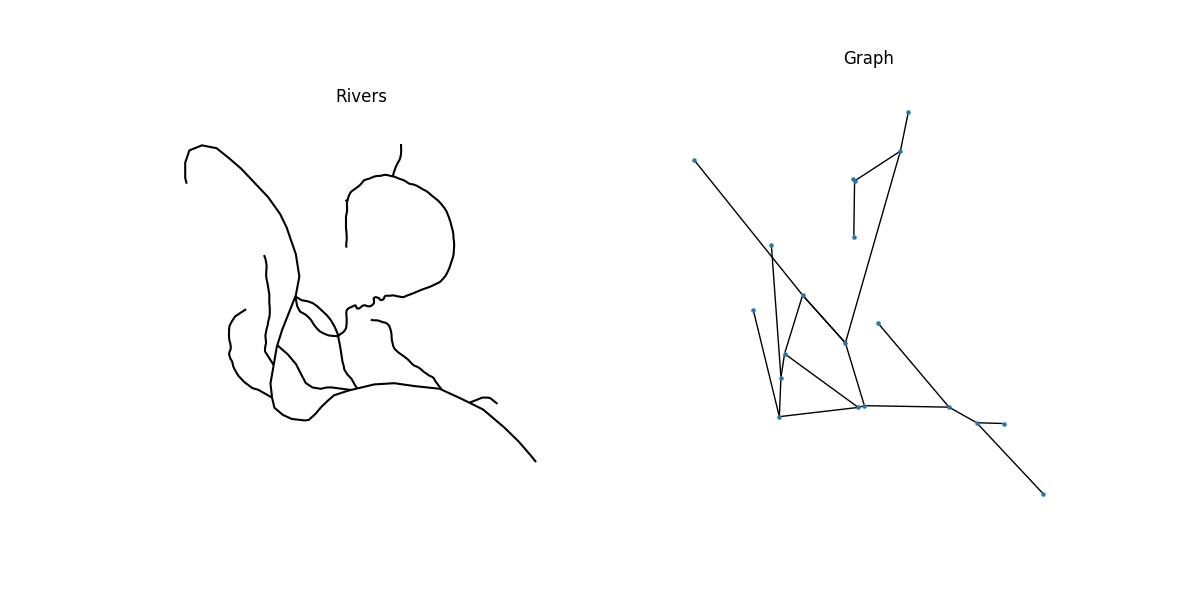
这个示例展示了如何使用GeoPandas、momepy以及PySAL从一组地理线(有时称为“线串”)构建图。我们将绘制一些河流和街道,以及由这些线段形成的图。
通常有两种方法从线几何创建图对象。让我们以街道网络为例来说明这两种方法:
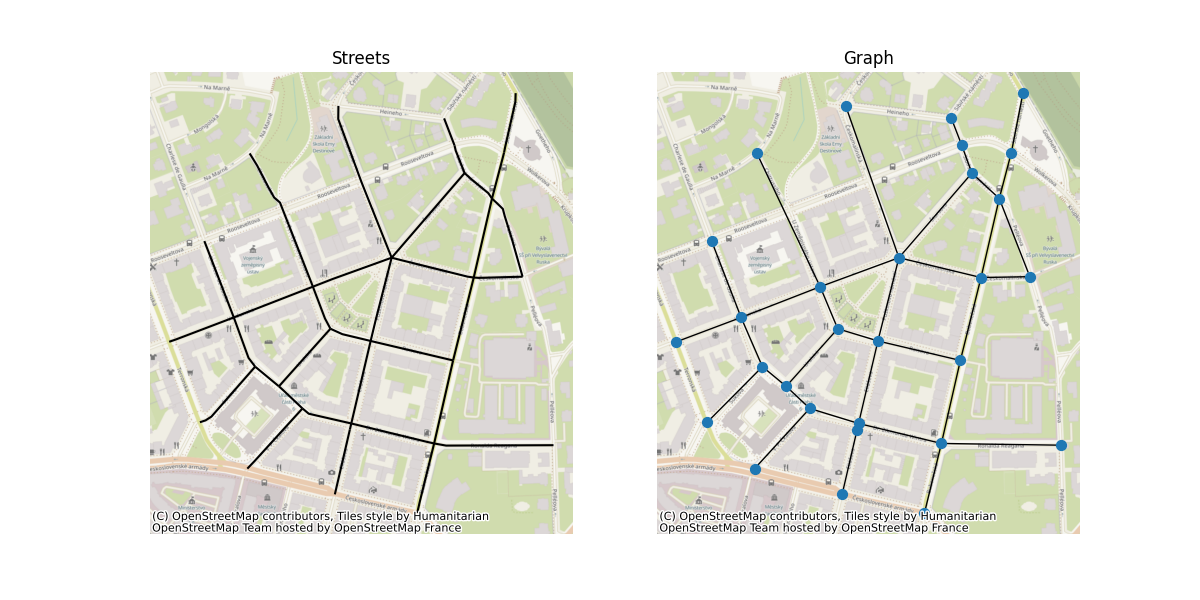
第一种方法是所谓的原始方法,其中每个交叉点是一个节点,每个连接两个交叉点的线串段是一条边。
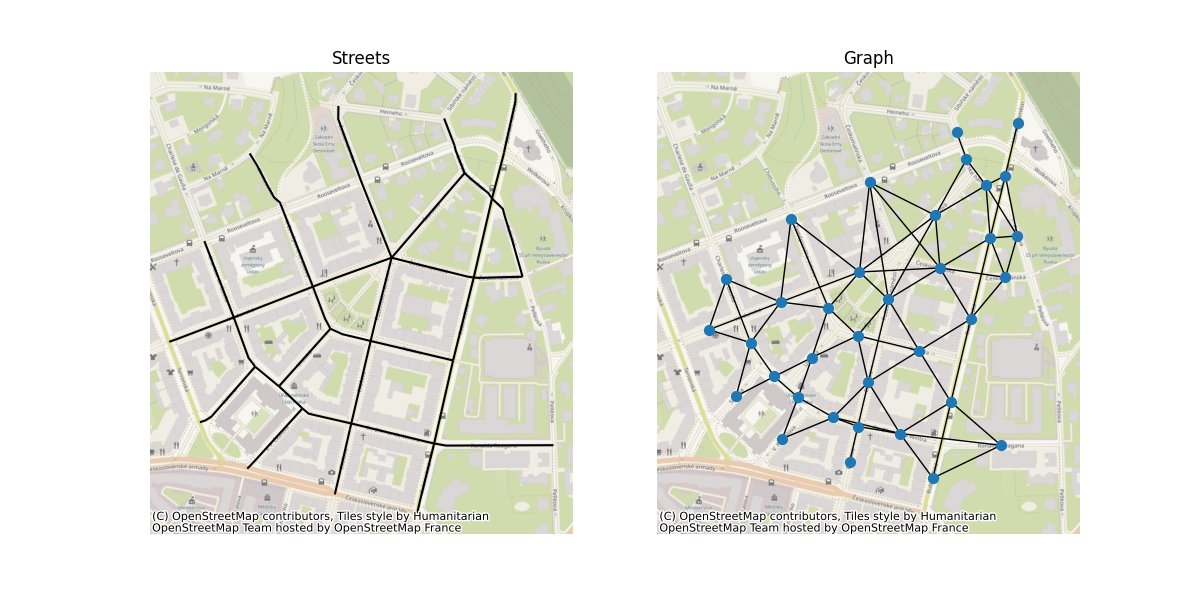
第二种方法是所谓的对偶方法,其中每条线是一个节点,交叉点的拓扑结构转化为边。这种方法在街道网络分析中的一个应用是角度分析,其中路由通过交叉点上街道线段之间的角度进行加权。
我们将使用GeoPandas读取空间数据,使用momepy生成第一个原始图,然后生成对偶图。此外,我们将使用PySAL来说明创建原始对偶图的另一种方法。
import geopandas
import matplotlib.pyplot as plt
import momepy
import networkx as nx
from contextily import add_basemap
from libpysal import weights
从GeoJSON读取示例河流几何数据。示例数据来源: https://doi.org/10.3390/data5010008 (尼古拉斯·卡迪尤)
rivers = geopandas.read_file("rivers.geojson")
构建原始图。momepy 自动保留所有属性 从GeoDataFrame中提取并存储为边属性。
G = momepy.gdf_to_nx(rivers, approach="primal")
每个节点通过其坐标进行编码,这使我们能够使用它们 in plotting.

一旦我们完成基于图的分析,我们可以将图转换回来 转换为 GeoDataFrames。momepy 可以将节点作为点几何返回, 边缘作为原始线几何和W对象,这是PySAL 空间权重矩阵编码原始图,以便我们使用 使用节点 GeoDataFrame 进行操作。
nodes, edges, W = momepy.nx_to_gdf(G, spatial_weights=True)


# 从GeoPackage读取示例街道网络
streets = geopandas.read_file(momepy.datasets.get_path("bubenec"), layer="streets")

# 构建原始图
G_primal = momepy.gdf_to_nx(streets, approach="primal")

# Plot
f, ax = plt.subplots(1, 2, figsize=(12, 6), sharex=True, sharey=True)
streets.plot(color="k", ax=ax[0])
for i, facet in enumerate(ax):
    facet.set_title(("Streets", "Graph")[i])
    facet.axis("off")
    try:  # 针对CI中下载/解析问题
        add_basemap(facet)
    except:
        pass
nx.draw(
    G_primal, {n: [n[0], n[1]] for n in list(G_primal.nodes)}, ax=ax[1], node_size=50
)

构建对偶图。momepy 会将行属性存储为节点属性,并且 自动测量线条之间的角度。
G_dual = momepy.gdf_to_nx(streets, approach="dual")

# Plot
f, ax = plt.subplots(1, 2, figsize=(12, 6), sharex=True, sharey=True)
streets.plot(color="k", ax=ax[0])
for i, facet in enumerate(ax):
    facet.set_title(("Streets", "Graph")[i])
    facet.axis("off")
    try:  # 针对CI中下载/解析问题
        add_basemap(facet)
    except:
        pass
nx.draw(G_dual, {n: [n[0], n[1]] for n in list(G_dual.nodes)}, ax=ax[1], node_size=50)
plt.show()

# 将双图转换回GeoDataFrame。仅返回原始线几何。
lines = momepy.nx_to_gdf(G_dual)

我们也可以使用PySAL构建对偶图。请注意,它仅编码 几何体之间的关系,并且不存储任何属性。然而,它是 比 momepy.gdf_to_nx() 快得多。 创建PySAL权重(图)。
W = weights.Queen.from_dataframe(streets)

# 将图转换为networkx
G_dual = W.to_networkx()
Total running time of the script: (0 minutes 22.010 seconds)