Note
Go to the end to download the full example code.
多边形构建的图#
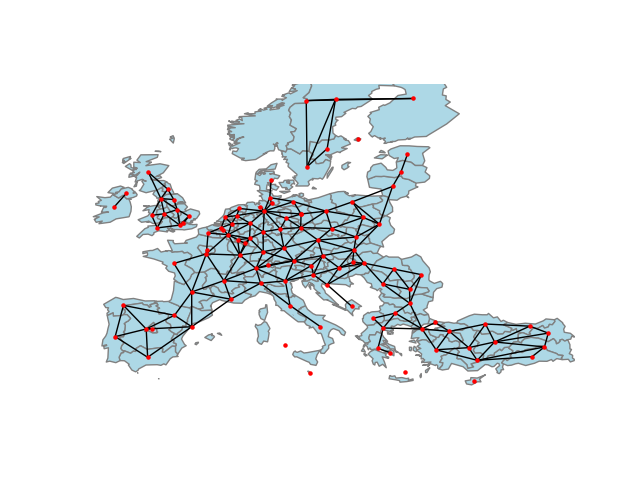
这个示例展示了如何使用PySAL和geopandas从一组多边形构建图。我们将重点介绍Queen邻接图,但同时也提供了Rook邻接图以及其他类型图的构造方法,这些图基于多边形的质心。

from libpysal import weights
import matplotlib.pyplot as plt
import networkx as nx
import geopandas
import numpy as np

# 从GeoJSON文件中读取示例数据。GeoJSON是一种文件格式
# 用于基于JSON编码地理数据。它对于
# 在网络上展示地理数据,并且越来越
# 用作地理数据文件格式。
filepath = "nuts1.geojson"
european_regions = geopandas.read_file(filepath)

# 提取用于连接区域的质心,即
# 定义多边形边界的坐标的平均值
centroids = np.column_stack((european_regions.centroid.x, european_regions.centroid.y))

# 构建“皇后”邻接图。在地理应用中,
# "Queen" 邻接图认为两个多边形是相连的,如果它们
# 它们在边界上共享一个点。这类似于
# "摩尔"邻域:规则网格中围绕的九个单元格。
queen = weights.Queen.from_dataframe(european_regions)

# 然后,我们可以使用该方法将图转换为networkx对象
# .to_networkx() method.
graph = queen.to_networkx()

# 要使用networkx进行绘图,我们需要将节点重新合并
# 为了在networkx中绘制,调整它们的位置
positions = dict(zip(graph.nodes, centroids))

# plot with a nice basemap
ax = european_regions.plot(linewidth=1, edgecolor="grey", facecolor="lightblue")
ax.axis([-12, 45, 33, 66])
ax.axis("off")
nx.draw(graph, positions, ax=ax, node_size=5, node_color="r")
plt.show()

# 从多边形构建图形的另一种方法可能是使用
# pygeos。这个包是GEOS C库的高性能接口。
# 库,用于计算地理关系。这些让我们
# 描述“点集”之间的关系,例如多边形是否
# 或者一条线是否“穿过”一个多边形,或者两个多边形是否“接触”。
# 这些关系,被称为“谓词”,非常广泛,并且有详细的文档说明
# by the pygeos package.
Total running time of the script: (0 minutes 0.238 seconds)