表格数据解释基准测试:Xgboost 回归
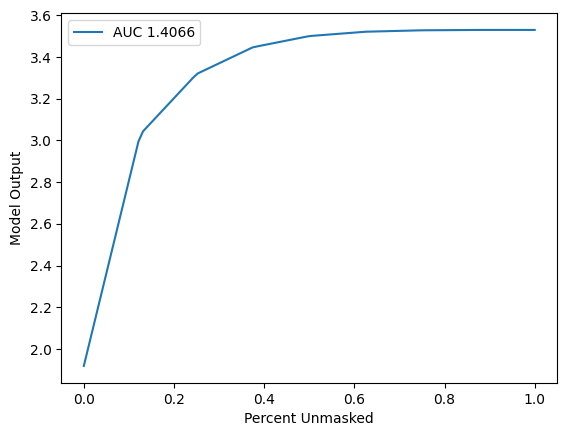
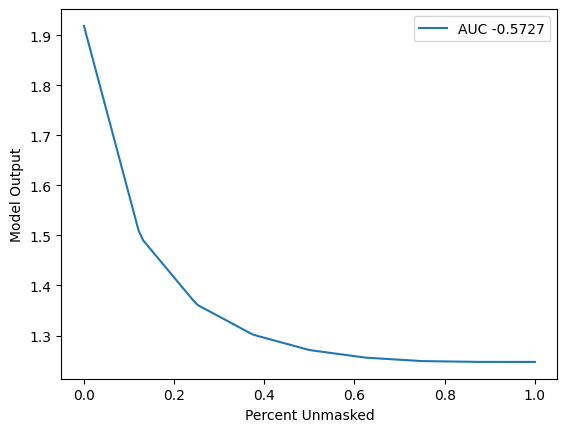
本笔记本演示了如何使用基准测试工具来测试表格数据解释器的性能。在此演示中,我们展示了 TreeExplainer 的解释性能。用于评估的指标是“保持正”和“保持负”。这里使用的掩码器是 IndependentMasker,但也可以推广到其他表格掩码器。
新的 benchmark 工具使用新的 API,以 MaskedModel 作为用户导入模型的包装器,并评估输入的掩码值。
[1]:
import xgboost
from sklearn.model_selection import train_test_split

import shap
import shap.benchmark as benchmark
加载数据和模型
[2]:
# create trained model for prediction function
untrained_model = xgboost.XGBRegressor(n_estimators=100, subsample=0.3)
X, y = shap.datasets.california()
X = X.values

test_size = 0.3
random_state = 0
X_train, X_test, y_train, y_test = train_test_split(
    X, y, test_size=test_size, random_state=random_state
)

model = untrained_model.fit(X_train, y_train)
定义解释器掩码
[3]:
# use Independent masker as default
masker = shap.maskers.Independent(X)
创建解释器对象
[4]:
# tree explainer is used
explainer = shap.Explainer(model, masker)
运行 SHAP 解释
[5]:
shap_values = explainer(X)
98%|===================| 20313/20640 [00:38<00:00]
定义指标(排序和扰动方法)
[6]:
sort_order = "positive"
perturbation = "keep"
基准解释器
[7]:
sp = benchmark._sequential.SequentialPerturbation(
    explainer.model, explainer.masker, sort_order, perturbation
)
sp_result = sp("SequentialPerturbation", shap_values.values, X)
sp.plot(sp_result.curve_x, sp_result.curve_y, sp_result.value)

[8]:
sort_order = "negative"
perturbation = "keep"
[9]:
sp = benchmark._sequential.SequentialPerturbation(
    explainer.model, explainer.masker, sort_order, perturbation
)
sp_result = sp("SequentialPerturbation", shap_values.values, X)
sp.plot(sp_result.curve_x, sp_result.curve_y, sp_result.value)
