%load_ext autoreload
%autoreload 2端到端演练
MLForecast 提供的所有功能的详细描述。
数据准备
在这个示例中,我们将使用 M4 每小时数据集的一个子集。您可以在 这里 找到包含完整数据集的笔记本。
import random
import tempfile
from pathlib import Path

import pandas as pd
from datasetsforecast.m4 import M4
from utilsforecast.plotting import plot_series
await M4.async_download('data', group='Hourly')
df, *_ = M4.load('data', 'Hourly')
uids = df['unique_id'].unique()
random.seed(0)
sample_uids = random.choices(uids, k=4)
df = df[df['unique_id'].isin(sample_uids)].reset_index(drop=True)
df['ds'] = df['ds'].astype('int64')
df| unique_id | ds | y | |
|---|---|---|---|
| 0 | H196 | 1 | 11.8 |
| 1 | H196 | 2 | 11.4 |
| 2 | H196 | 3 | 11.1 |
| 3 | H196 | 4 | 10.8 |
| 4 | H196 | 5 | 10.6 |
| ... | ... | ... | ... |
| 4027 | H413 | 1004 | 99.0 |
| 4028 | H413 | 1005 | 88.0 |
| 4029 | H413 | 1006 | 47.0 |
| 4030 | H413 | 1007 | 41.0 |
| 4031 | H413 | 1008 | 34.0 |
4032 rows × 3 columns
EDA(探索性数据分析)
我们将查看我们的系列,以获取变换和特征的灵感。
fig = plot_series(df, max_insample_length=24 * 14)fig.savefig('../../figs/end_to_end_walkthrough__eda.png', bbox_inches='tight')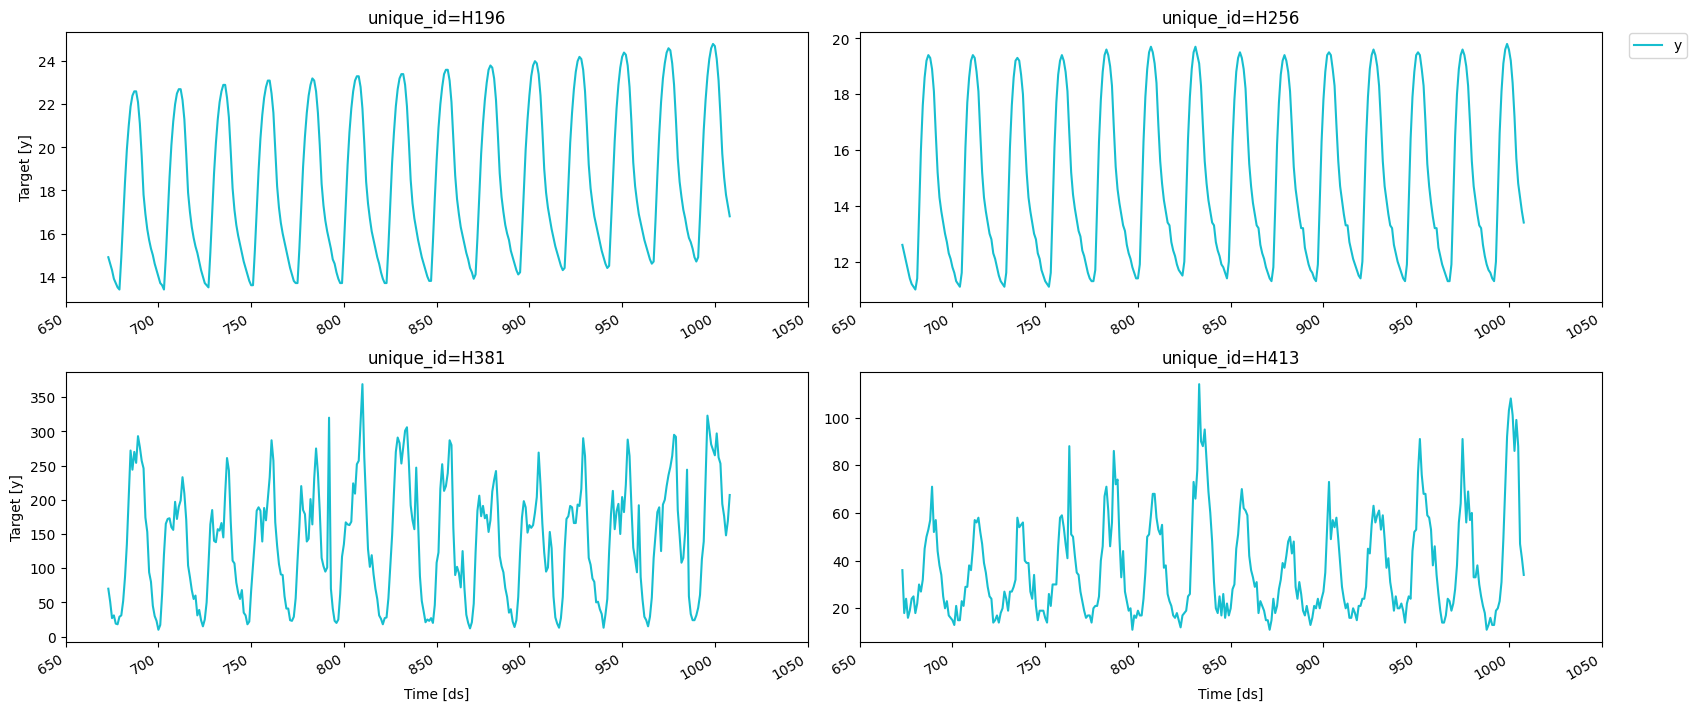
我们可以使用 MLForecast.preprocess 方法来探索不同的变换。看起来这些序列在一天中的小时上有很强的季节性,因此我们可以从前一天的同一小时减去该值以去除季节性。这可以通过 mlforecast.target_transforms.Differences 转换器来完成,我们将其传递给 target_transforms。
from mlforecast import MLForecast
from mlforecast.target_transforms import Differences
fcst = MLForecast(
models=[], # we're not interested in modeling yet
freq=1, # our series have integer timestamps, so we'll just add 1 in every timestep
target_transforms=[Differences([24])],
)
prep = fcst.preprocess(df)
prep| unique_id | ds | y | |
|---|---|---|---|
| 24 | H196 | 25 | 0.3 |
| 25 | H196 | 26 | 0.3 |
| 26 | H196 | 27 | 0.1 |
| 27 | H196 | 28 | 0.2 |
| 28 | H196 | 29 | 0.2 |
| ... | ... | ... | ... |
| 4027 | H413 | 1004 | 39.0 |
| 4028 | H413 | 1005 | 55.0 |
| 4029 | H413 | 1006 | 14.0 |
| 4030 | H413 | 1007 | 3.0 |
| 4031 | H413 | 1008 | 4.0 |
3936 rows × 3 columns
这已经从每个值中减去了滞后24,我们可以看到我们的序列现在的样子。
fig = plot_series(prep)fig.savefig('../../figs/end_to_end_walkthrough__differences.png', bbox_inches='tight')
添加特征
滞后
看起来季节性已经消失,我们现在可以尝试添加一些滞后特征。
fcst = MLForecast(
    models=[],
    freq=1,
    lags=[1, 24],
    target_transforms=[Differences([24])],
)
prep = fcst.preprocess(df)
prep| unique_id | ds | y | lag1 | lag24 | |
|---|---|---|---|---|---|
| 48 | H196 | 49 | 0.1 | 0.1 | 0.3 |
| 49 | H196 | 50 | 0.1 | 0.1 | 0.3 |
| 50 | H196 | 51 | 0.2 | 0.1 | 0.1 |
| 51 | H196 | 52 | 0.1 | 0.2 | 0.2 |
| 52 | H196 | 53 | 0.1 | 0.1 | 0.2 |
| ... | ... | ... | ... | ... | ... |
| 4027 | H413 | 1004 | 39.0 | 29.0 | 1.0 |
| 4028 | H413 | 1005 | 55.0 | 39.0 | -25.0 |
| 4029 | H413 | 1006 | 14.0 | 55.0 | -20.0 |
| 4030 | H413 | 1007 | 3.0 | 14.0 | 0.0 |
| 4031 | H413 | 1008 | 4.0 | 3.0 | -16.0 |
3840 rows × 5 columns
prep.drop(columns=['unique_id', 'ds']).corr()['y']y 1.000000
lag1 0.622531
lag24 -0.234268
Name: y, dtype: float64滞后变换
滞后变换被定义为一个字典,其中键是滞后值,值是我们想要应用于该滞后的变换。滞后变换可以是来自 mlforecast.lag_transforms 模块的对象,也可以是 numba 编译过的函数(这样计算特征时不会成为瓶颈,并且在使用多线程时可以绕过全局解释器锁),我们在 window-ops 包 中实现了一些,但你也可以自己实现。
from mlforecast.lag_transforms import ExpandingMean, RollingMean
from numba import njit
from window_ops.rolling import rolling_mean
@njit
def rolling_mean_48(x):
return rolling_mean(x, window_size=48)
fcst = MLForecast(
models=[],
freq=1,
target_transforms=[Differences([24])],
lag_transforms={
1: [ExpandingMean()],
24: [RollingMean(window_size=48), rolling_mean_48],
},
)
prep = fcst.preprocess(df)
prep| unique_id | ds | y | expanding_mean_lag1 | rolling_mean_lag24_window_size48 | rolling_mean_48_lag24 | |
|---|---|---|---|---|---|---|
| 95 | H196 | 96 | 0.1 | 0.174648 | 0.150000 | 0.150000 |
| 96 | H196 | 97 | 0.3 | 0.173611 | 0.145833 | 0.145833 |
| 97 | H196 | 98 | 0.3 | 0.175342 | 0.141667 | 0.141667 |
| 98 | H196 | 99 | 0.3 | 0.177027 | 0.141667 | 0.141667 |
| 99 | H196 | 100 | 0.3 | 0.178667 | 0.141667 | 0.141667 |
| ... | ... | ... | ... | ... | ... | ... |
| 4027 | H413 | 1004 | 39.0 | 0.242084 | 3.437500 | 3.437500 |
| 4028 | H413 | 1005 | 55.0 | 0.281633 | 2.708333 | 2.708333 |
| 4029 | H413 | 1006 | 14.0 | 0.337411 | 2.125000 | 2.125000 |
| 4030 | H413 | 1007 | 3.0 | 0.351324 | 1.770833 | 1.770833 |
| 4031 | H413 | 1008 | 4.0 | 0.354018 | 1.208333 | 1.208333 |
3652 rows × 6 columns
你可以看到这两种方法得到了相同的结果,你可以使用任何一种你感到最舒适的方法。
日期特征
如果您的时间列由时间戳组成,那么提取一些特征,如星期、星期几、季度等,可能是有意义的。您可以通过传递一个包含pandas时间/日期组件的字符串列表来实现。此外,您还可以传递将时间列作为输入的函数,如我们这里所示。
def hour_index(times):
    return times % 24

fcst = MLForecast(
    models=[],
    freq=1,
    target_transforms=[Differences([24])],
    date_features=[hour_index],
)
fcst.preprocess(df)| unique_id | ds | y | hour_index | |
|---|---|---|---|---|
| 24 | H196 | 25 | 0.3 | 1 |
| 25 | H196 | 26 | 0.3 | 2 |
| 26 | H196 | 27 | 0.1 | 3 |
| 27 | H196 | 28 | 0.2 | 4 |
| 28 | H196 | 29 | 0.2 | 5 |
| ... | ... | ... | ... | ... |
| 4027 | H413 | 1004 | 39.0 | 20 |
| 4028 | H413 | 1005 | 55.0 | 21 |
| 4029 | H413 | 1006 | 14.0 | 22 |
| 4030 | H413 | 1007 | 3.0 | 23 |
| 4031 | H413 | 1008 | 4.0 | 0 |
3936 rows × 4 columns
目标变换
如果您想在计算特征之前对目标进行一些转换,然后在预测后重新应用,可以使用 target_transforms 参数,该参数接受一个转换列表。您可以在 mlforecast.target_transforms 中找到已实现的转换,或者按照 目标转换指南 中的描述实现您自己的转换。
from mlforecast.target_transforms import LocalStandardScalerfcst = MLForecast(
models=[],
freq=1,
lags=[1],
target_transforms=[LocalStandardScaler()]
)
fcst.preprocess(df)| unique_id | ds | y | lag1 | |
|---|---|---|---|---|
| 1 | H196 | 2 | -1.493026 | -1.383286 |
| 2 | H196 | 3 | -1.575331 | -1.493026 |
| 3 | H196 | 4 | -1.657635 | -1.575331 |
| 4 | H196 | 5 | -1.712505 | -1.657635 |
| 5 | H196 | 6 | -1.794810 | -1.712505 |
| ... | ... | ... | ... | ... |
| 4027 | H413 | 1004 | 3.062766 | 2.425012 |
| 4028 | H413 | 1005 | 2.523128 | 3.062766 |
| 4029 | H413 | 1006 | 0.511751 | 2.523128 |
| 4030 | H413 | 1007 | 0.217403 | 0.511751 |
| 4031 | H413 | 1008 | -0.126003 | 0.217403 |
4028 rows × 4 columns
我们可以定义一个简单模型来测试这个。
from sklearn.base import BaseEstimator

class Naive(BaseEstimator):
    def fit(self, X, y):
        return self

    def predict(self, X):
        return X['lag1']
fcst = MLForecast(
models=[Naive()],
freq=1,
lags=[1],
target_transforms=[LocalStandardScaler()]
)
fcst.fit(df)
preds = fcst.predict(1)
preds| unique_id | ds | Naive | |
|---|---|---|---|
| 0 | H196 | 1009 | 16.8 |
| 1 | H256 | 1009 | 13.4 |
| 2 | H381 | 1009 | 207.0 |
| 3 | H413 | 1009 | 34.0 |
我们将其与我们系列的最后值进行比较。
last_vals = df.groupby('unique_id').tail(1)
last_vals| unique_id | ds | y | |
|---|---|---|---|
| 1007 | H196 | 1008 | 16.8 |
| 2015 | H256 | 1008 | 13.4 |
| 3023 | H381 | 1008 | 207.0 |
| 4031 | H413 | 1008 | 34.0 |
import numpy as npnp.testing.assert_allclose(preds['Naive'], last_vals['y'])训练
一旦你决定了要使用的特征、转换和模型,你可以改用 MLForecast.fit 方法,它将进行预处理,然后训练模型。模型可以作为一个列表指定(如果存在重复类,将使用它们的类名和索引进行命名),也可以作为一个字典,其中键是你想要赋给模型的名称,即将保存其预测的列名,值则是模型本身。
import lightgbm as lgblgb_params = {
'verbosity': -1,
'num_leaves': 512,
}
fcst = MLForecast(
models={
'avg': lgb.LGBMRegressor(**lgb_params),
'q75': lgb.LGBMRegressor(**lgb_params, objective='quantile', alpha=0.75),
'q25': lgb.LGBMRegressor(**lgb_params, objective='quantile', alpha=0.25),
},
freq=1,
target_transforms=[Differences([24])],
lags=[1, 24],
lag_transforms={
1: [ExpandingMean()],
24: [RollingMean(window_size=48)],
},
date_features=[hour_index],
)
fcst.fit(df)MLForecast(models=[avg, q75, q25], freq=1, lag_features=['lag1', 'lag24', 'expanding_mean_lag1', 'rolling_mean_lag24_window_size48'], date_features=[<function hour_index>], num_threads=1)这计算了特征并使用这些特征训练了三种不同的模型。我们现在可以计算我们的预测。
预测
preds = fcst.predict(48)
preds| unique_id | ds | avg | q75 | q25 | |
|---|---|---|---|---|---|
| 0 | H196 | 1009 | 16.295257 | 16.357148 | 16.315731 |
| 1 | H196 | 1010 | 15.910282 | 16.007322 | 15.862261 |
| 2 | H196 | 1011 | 15.728367 | 15.780183 | 15.658180 |
| 3 | H196 | 1012 | 15.468414 | 15.513598 | 15.399717 |
| 4 | H196 | 1013 | 15.081279 | 15.133848 | 15.007694 |
| ... | ... | ... | ... | ... | ... |
| 187 | H413 | 1052 | 100.450617 | 124.211150 | 47.025017 |
| 188 | H413 | 1053 | 88.426800 | 108.303409 | 44.715380 |
| 189 | H413 | 1054 | 59.675737 | 81.859964 | 19.239462 |
| 190 | H413 | 1055 | 57.580356 | 72.703301 | 21.486674 |
| 191 | H413 | 1056 | 42.669879 | 46.018271 | 24.392357 |
192 rows × 5 columns
fig = plot_series(df, preds, max_insample_length=24 * 7)fig.savefig('../../figs/end_to_end_walkthrough__predictions.png', bbox_inches='tight')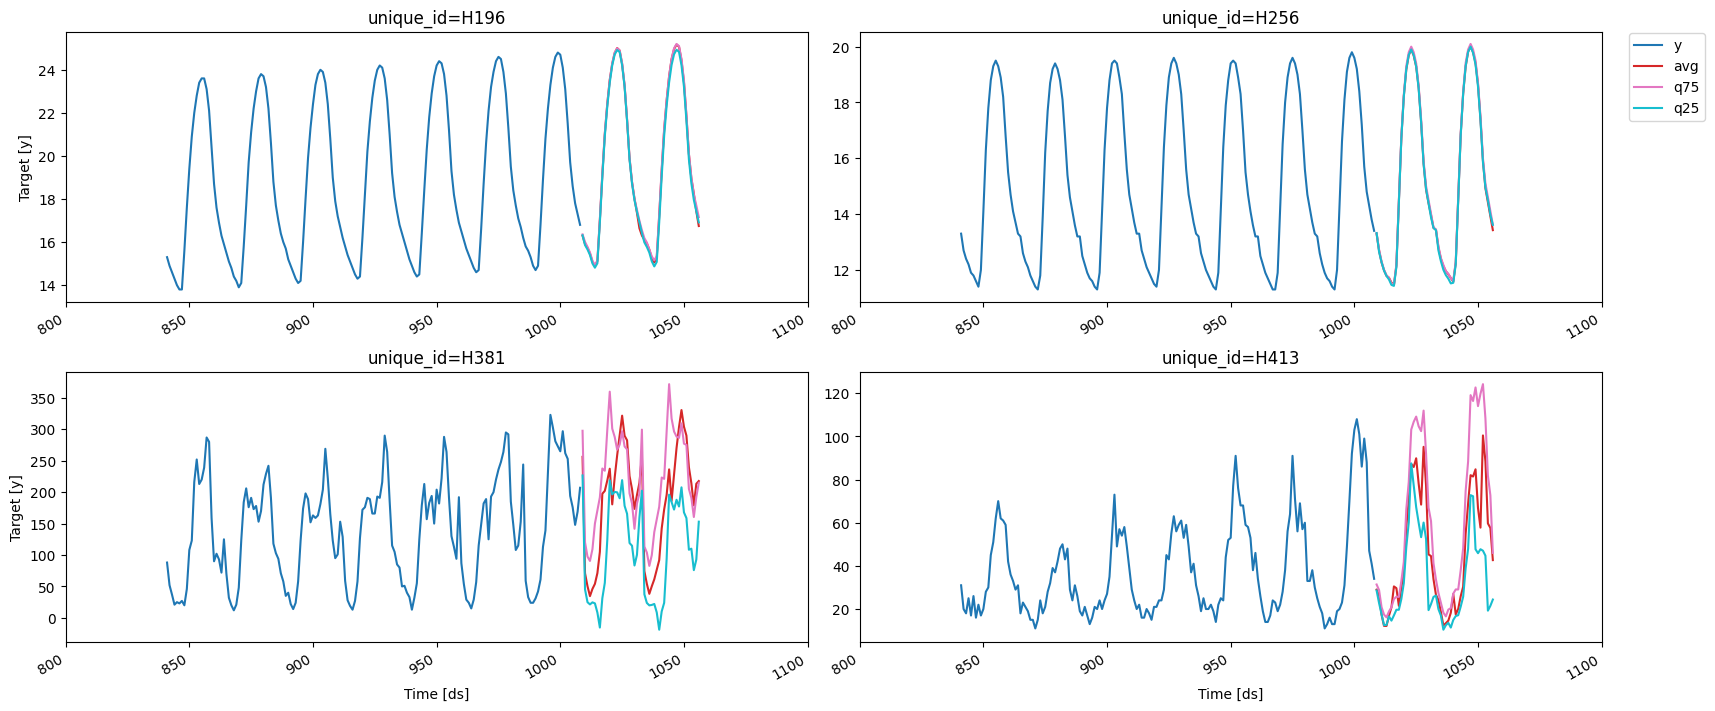
保存与加载
MLForecast类具有MLForecast.save和MLForecast.load方法,用于存储和加载预测对象。
with tempfile.TemporaryDirectory() as tmpdir:
    save_dir = Path(tmpdir) / 'mlforecast'
    fcst.save(save_dir)
    fcst2 = MLForecast.load(save_dir)
    preds2 = fcst2.predict(48)
    pd.testing.assert_frame_equal(preds, preds2)
更新系列的值
在训练完预测对象后,您可以使用之前的方法保存和加载它。如果在您想使用它的时候已经知道目标的下一个值,可以使用 MLForecast.update 方法来将这些值纳入,这将允许您在计算预测时使用这些新值。
- 如果没有为当前存储的系列提供新值,则仅保留之前的值。
- 如果包含新的系列,则将其添加到现有的系列中。
fcst = MLForecast(
    models=[Naive()],
    freq=1,
    lags=[1, 2, 3],
)
fcst.fit(df)
fcst.predict(1)| unique_id | ds | Naive | |
|---|---|---|---|
| 0 | H196 | 1009 | 16.8 |
| 1 | H256 | 1009 | 13.4 |
| 2 | H381 | 1009 | 207.0 |
| 3 | H413 | 1009 | 34.0 |
new_values = pd.DataFrame({
    'unique_id': ['H196', 'H256'],
    'ds': [1009, 1009],
    'y': [17.0, 14.0],
})
fcst.update(new_values)
preds = fcst.predict(1)
preds| unique_id | ds | Naive | |
|---|---|---|---|
| 0 | H196 | 1010 | 17.0 |
| 1 | H256 | 1010 | 14.0 |
| 2 | H381 | 1009 | 207.0 |
| 3 | H413 | 1009 | 34.0 |
new_values_with_offset = new_values.copy()
new_values_with_offset['ds'] += 1
previous_values_with_offset = df[~df['unique_id'].isin(new_values['unique_id'])].groupby('unique_id').tail(1).copy()
previous_values_with_offset['ds'] += 1
pd.testing.assert_frame_equal(
    preds,
    pd.concat([new_values_with_offset, previous_values_with_offset]).reset_index(drop=True).rename(columns={'y': 'Naive'}),
)
估计模型性能
交叉验证
为了估计我们的模型在预测未来数据时的表现,我们可以进行交叉验证,这包括在数据的不同子集上独立训练几个模型,使用它们来预测验证集并测量它们的表现。
由于我们的数据是时间依赖的,我们通过移除序列的最后部分并将其用作验证集来进行拆分。这个过程在 MLForecast.cross_validation 中实现。
fcst = MLForecast(
    models=lgb.LGBMRegressor(**lgb_params),
    freq=1,
    target_transforms=[Differences([24])],
    lags=[1, 24],
    lag_transforms={
        1: [ExpandingMean()],
        24: [RollingMean(window_size=48)],
    },
    date_features=[hour_index],
)
cv_result = fcst.cross_validation(
    df,
    n_windows=4,  # 需要训练的模型数量/需要进行的分割次数
    h=48,  # 每个窗口中验证集的长度
)
cv_result| unique_id | ds | cutoff | y | LGBMRegressor | |
|---|---|---|---|---|---|
| 0 | H196 | 817 | 816 | 15.3 | 15.383165 |
| 1 | H196 | 818 | 816 | 14.9 | 14.923219 |
| 2 | H196 | 819 | 816 | 14.6 | 14.667834 |
| 3 | H196 | 820 | 816 | 14.2 | 14.275964 |
| 4 | H196 | 821 | 816 | 13.9 | 13.973491 |
| ... | ... | ... | ... | ... | ... |
| 763 | H413 | 1004 | 960 | 99.0 | 65.644823 |
| 764 | H413 | 1005 | 960 | 88.0 | 71.717097 |
| 765 | H413 | 1006 | 960 | 47.0 | 76.704377 |
| 766 | H413 | 1007 | 960 | 41.0 | 53.446638 |
| 767 | H413 | 1008 | 960 | 34.0 | 54.902634 |
768 rows × 5 columns
fig = plot_series(forecasts_df=cv_result.drop(columns='cutoff'))fig.savefig('../../figs/end_to_end_walkthrough__cv.png', bbox_inches='tight')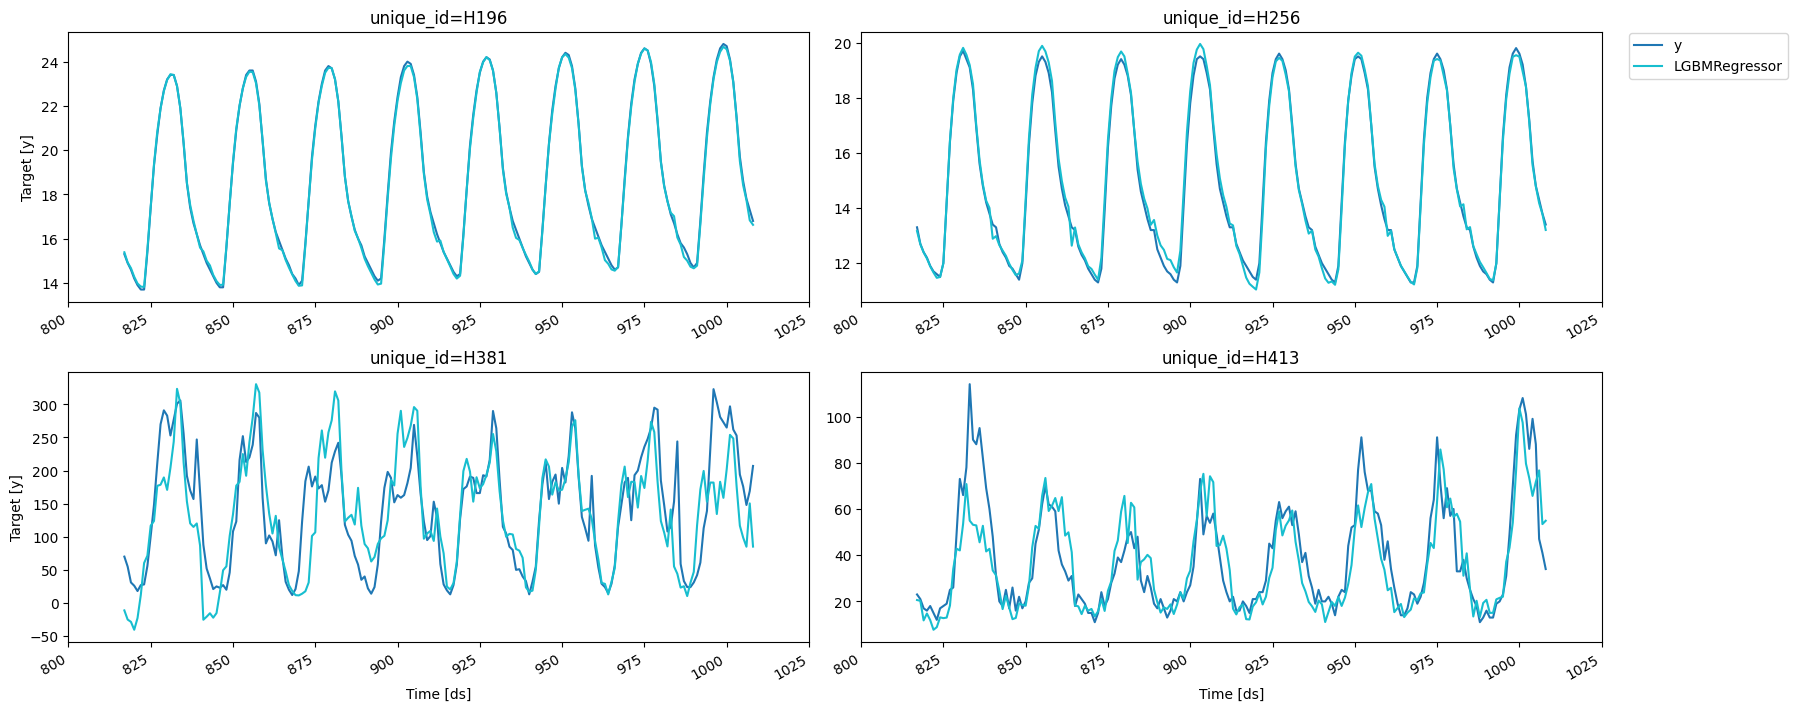
我们可以在每个拆分上计算RMSE。
from utilsforecast.losses import rmsedef evaluate_cv(df):
return rmse(df, models=['LGBMRegressor'], id_col='cutoff').set_index('cutoff')
split_rmse = evaluate_cv(cv_result)
split_rmse| LGBMRegressor | |
|---|---|
| cutoff | |
| 816 | 29.418172 |
| 864 | 34.257598 |
| 912 | 13.145763 |
| 960 | 35.066261 |
以及跨切分的平均RMSE。
split_rmse.mean()LGBMRegressor 27.971949
dtype: float64您可以通过这种方式快速尝试不同的特征并评估它们。我们可以尝试去掉差分,而使用滞后1的指数加权平均代替扩展均值。
from mlforecast.lag_transforms import ExponentiallyWeightedMeanfcst = MLForecast(
models=lgb.LGBMRegressor(**lgb_params),
freq=1,
lags=[1, 24],
lag_transforms={
1: [ExponentiallyWeightedMean(alpha=0.5)],
24: [RollingMean(window_size=48)],
},
date_features=[hour_index],
)
cv_result2 = fcst.cross_validation(
df,
n_windows=4,
h=48,
)
evaluate_cv(cv_result2).mean()LGBMRegressor 25.874439
dtype: float64LightGBMCV
为了估计我们模型的性能,LightGBMCV 允许我们在数据的不同分区上训练几个 LightGBM 模型。与 MLForecast.cross_validation 的主要区别如下:
- 它只能训练 LightGBM 模型。
- 它同时训练所有模型,并给我们提供整个预测窗口内每次迭代的错误平均值,这使我们能够找到最佳迭代。
from mlforecast.lgb_cv import LightGBMCVcv = LightGBMCV(
freq=1,
target_transforms=[Differences([24])],
lags=[1, 24],
lag_transforms={
1: [ExpandingMean()],
24: [RollingMean(window_size=48)],
},
date_features=[hour_index],
num_threads=2,
)
cv_hist = cv.fit(
df,
n_windows=4,
h=48,
params=lgb_params,
eval_every=5,
early_stopping_evals=5,
compute_cv_preds=True,
)[5] mape: 0.158639
[10] mape: 0.163739
[15] mape: 0.161535
[20] mape: 0.169491
[25] mape: 0.163690
[30] mape: 0.164198
Early stopping at round 30
Using best iteration: 5正如您所看到的,迭代时会给我们带来错误(由eval_every参数控制),并执行提前停止(可以通过early_stopping_evals和early_stopping_pct配置)。如果您将compute_cv_preds=True,则将使用找到的最佳迭代计算出袋预测,并将其保存在cv_preds_属性中。
cv.cv_preds_| unique_id | ds | y | Booster | window | |
|---|---|---|---|---|---|
| 0 | H196 | 817 | 15.3 | 15.473182 | 0 |
| 1 | H196 | 818 | 14.9 | 15.038571 | 0 |
| 2 | H196 | 819 | 14.6 | 14.849409 | 0 |
| 3 | H196 | 820 | 14.2 | 14.448379 | 0 |
| 4 | H196 | 821 | 13.9 | 14.148379 | 0 |
| ... | ... | ... | ... | ... | ... |
| 187 | H413 | 1004 | 99.0 | 61.425396 | 3 |
| 188 | H413 | 1005 | 88.0 | 62.886890 | 3 |
| 189 | H413 | 1006 | 47.0 | 57.886890 | 3 |
| 190 | H413 | 1007 | 41.0 | 38.849009 | 3 |
| 191 | H413 | 1008 | 34.0 | 44.720562 | 3 |
768 rows × 5 columns
fig = plot_series(forecasts_df=cv.cv_preds_.drop(columns='window'))fig.savefig('../../figs/end_to_end_walkthrough__lgbcv.png', bbox_inches='tight')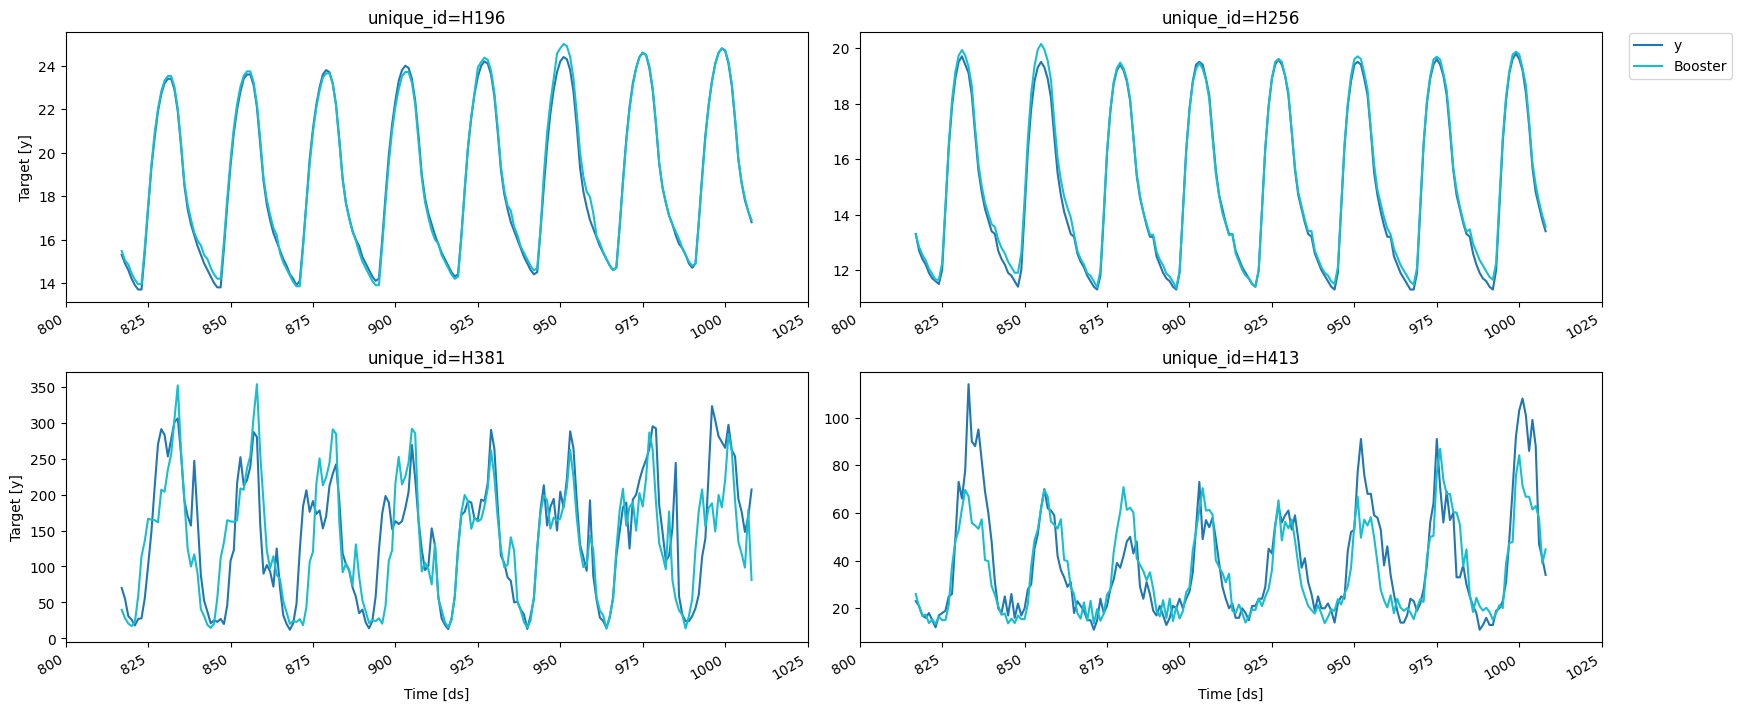
您可以使用这个类快速尝试不同的特征和超参数配置。一旦您找到了一个有效的组合,您可以通过从 LightGBMCV 对象创建 MLForecast 对象,在所有数据上使用这些特征和超参数训练模型,如下所示:
final_fcst = MLForecast.from_cv(cv)
final_fcst.fit(df)
preds = final_fcst.predict(48)
fig = plot_series(df, preds, max_insample_length=24 * 14)fig.savefig('../../figs/end_to_end_walkthrough__final_forecast.png', bbox_inches='tight')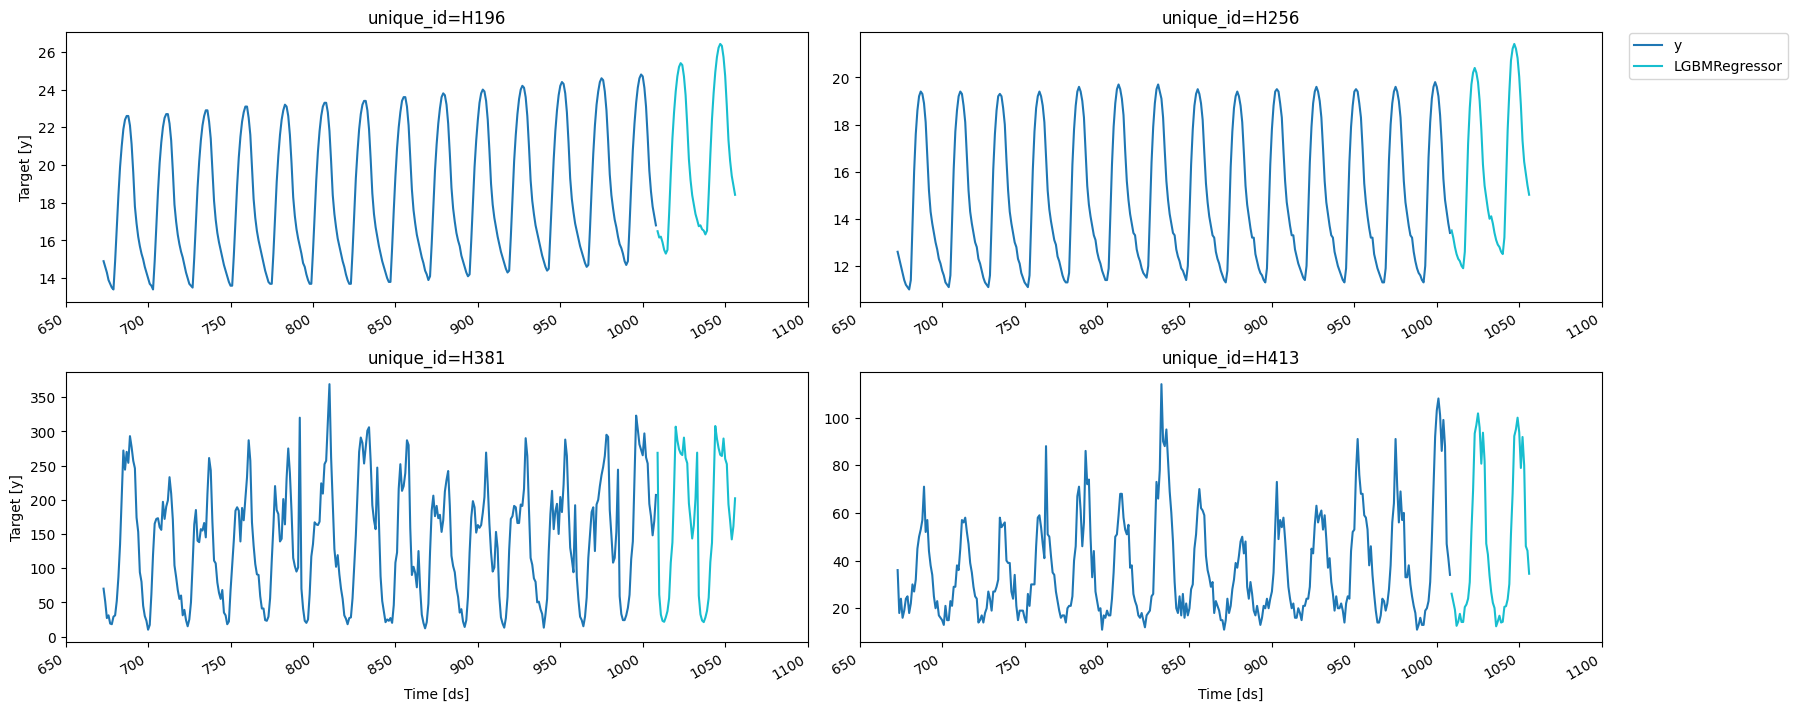
Give us a ⭐ on Github