Note
Go to the end to download the full example code.
去密度化#
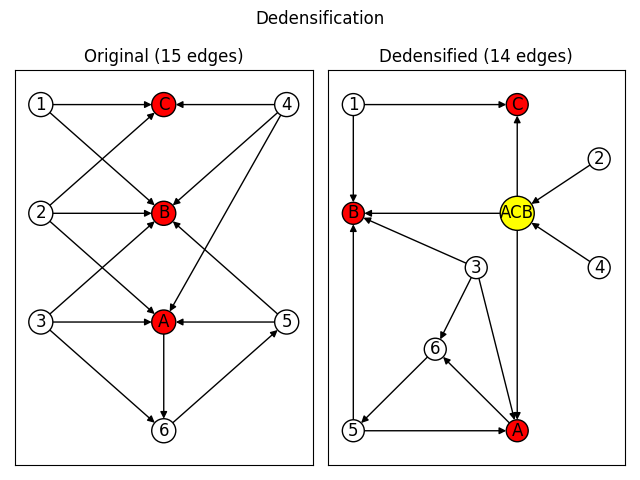
图去密度化的示例。去密度化保留了原始图的结构模式,并且只有在这样做会减少压缩图中边的数量时,才会添加压缩节点。

import matplotlib.pyplot as plt
import networkx as nx

plt.suptitle("Dedensification")

original_graph = nx.DiGraph()
white_nodes = ["1", "2", "3", "4", "5", "6"]
red_nodes = ["A", "B", "C"]
node_sizes = [250 for node in white_nodes + red_nodes]
node_colors = ["white" for n in white_nodes] + ["red" for n in red_nodes]

original_graph.add_nodes_from(white_nodes + red_nodes)
original_graph.add_edges_from(
    [
        ("1", "C"),
        ("1", "B"),
        ("2", "C"),
        ("2", "B"),
        ("2", "A"),
        ("3", "B"),
        ("3", "A"),
        ("3", "6"),
        ("4", "C"),
        ("4", "B"),
        ("4", "A"),
        ("5", "B"),
        ("5", "A"),
        ("6", "5"),
        ("A", "6"),
    ]
)
base_options = {"with_labels": True, "edgecolors": "black"}
pos = {
    "3": (0, 1),
    "2": (0, 2),
    "1": (0, 3),
    "6": (1, 0),
    "A": (1, 1),
    "B": (1, 2),
    "C": (1, 3),
    "4": (2, 3),
    "5": (2, 1),
}
ax1 = plt.subplot(1, 2, 1)
plt.title(f"Original ({original_graph.number_of_edges()} edges)")
nx.draw_networkx(original_graph, pos=pos, node_color=node_colors, **base_options)

nonexp_graph, compression_nodes = nx.summarization.dedensify(
    original_graph, threshold=2, copy=False
)
nonexp_node_colors = list(node_colors)
nonexp_node_sizes = list(node_sizes)
for node in compression_nodes:
    nonexp_node_colors.append("yellow")
    nonexp_node_sizes.append(600)
plt.subplot(1, 2, 2)

plt.title(f"Dedensified ({nonexp_graph.number_of_edges()} edges)")
nonexp_pos = {
    "5": (0, 0),
    "B": (0, 2),
    "1": (0, 3),
    "6": (1, 0.75),
    "3": (1.5, 1.5),
    "A": (2, 0),
    "C": (2, 3),
    "4": (3, 1.5),
    "2": (3, 2.5),
}
c_nodes = list(compression_nodes)
c_nodes.sort()
for spot, node in enumerate(c_nodes):
    nonexp_pos[node] = (2, spot + 2)
nx.draw_networkx(
    nonexp_graph,
    pos=nonexp_pos,
    node_color=nonexp_node_colors,
    node_size=nonexp_node_sizes,
    **base_options,
)

plt.tight_layout()
plt.show()
Total running time of the script: (0 minutes 0.102 seconds)
