Note
Go to the end to download the full example code.
使用Girvan-Newman方法的社区检测#
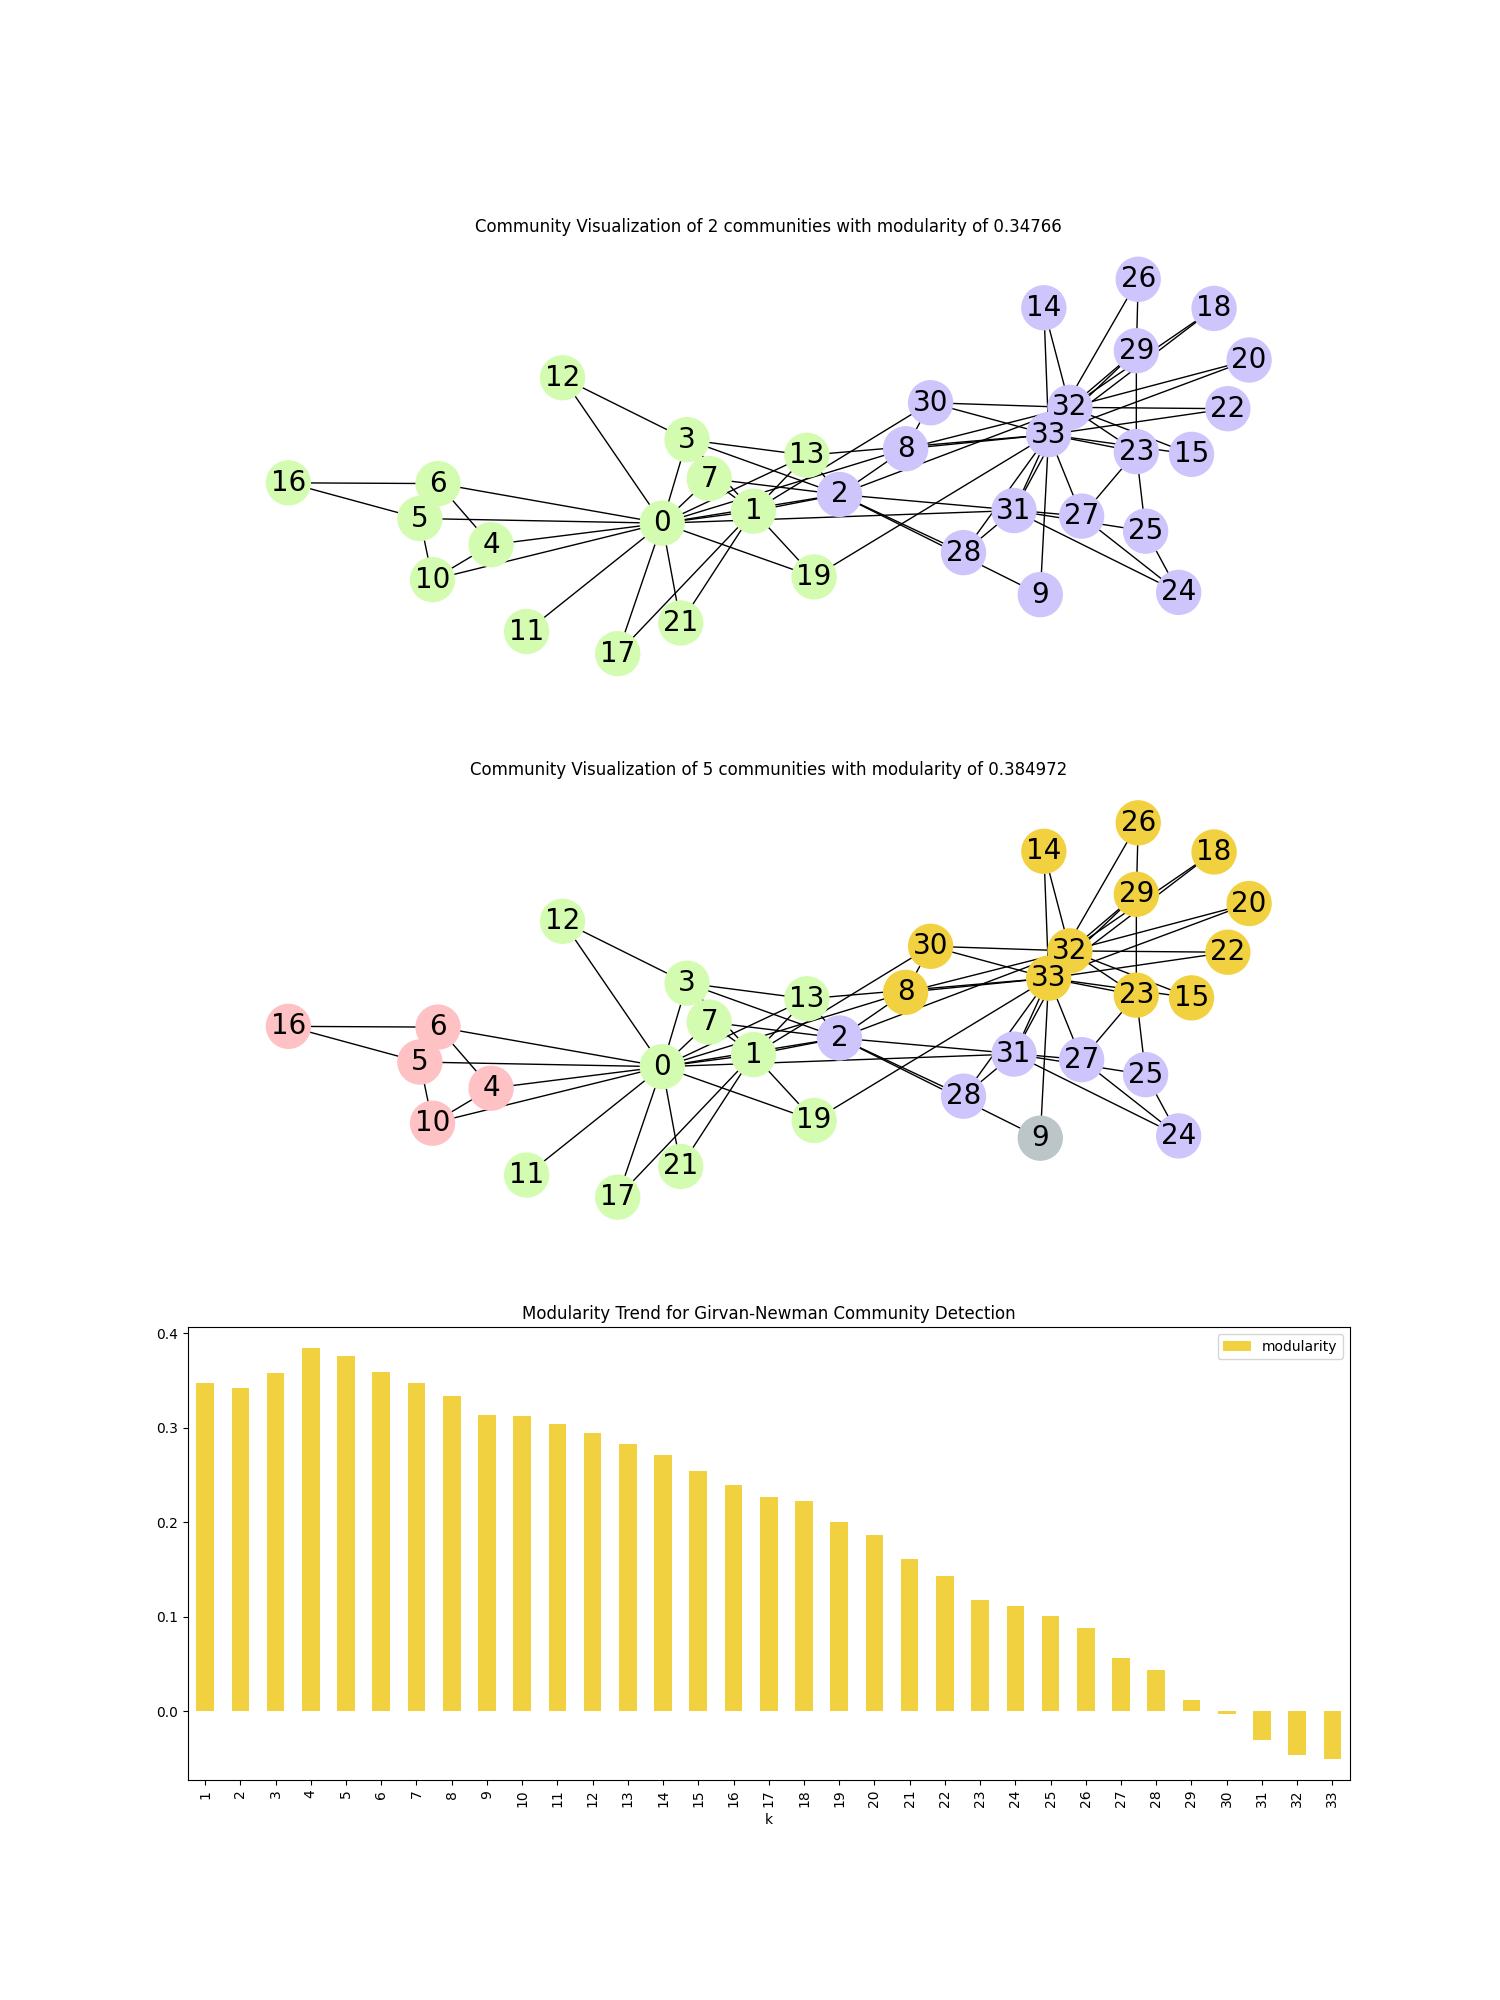
这个示例展示了使用Girvan-Newman方法在Zachary空手道俱乐部数据集中检测社区的情况。
我们绘制了随着重要边被移除时模块度的变化。 根据社区检测结果,当迭代次数分别为1和4时,图的颜色和绘制方式会有所不同。

import networkx as nx
import pandas as pd
import matplotlib.pyplot as plt

# 加载空手道图并使用Girvan-Newman方法寻找社区
G = nx.karate_club_graph()
communities = list(nx.community.girvan_newman(G))

# 模块化 -> 衡量网络划分成模块的强度
modularity_df = pd.DataFrame(
    [
        [k + 1, nx.community.modularity(G, communities[k])]
        for k in range(len(communities))
    ],
    columns=["k", "modularity"],
)


# 创建节点颜色列表的函数
def create_community_node_colors(graph, communities):
    number_of_colors = len(communities[0])
    colors = ["#D4FCB1", "#CDC5FC", "#FFC2C4", "#F2D140", "#BCC6C8"][:number_of_colors]
    node_colors = []
    for node in graph:
        current_community_index = 0
        for community in communities:
            if node in community:
                node_colors.append(colors[current_community_index])
                break
            current_community_index += 1
    return node_colors


# 根据社区对节点进行着色的绘图函数
def visualize_communities(graph, communities, i):
    node_colors = create_community_node_colors(graph, communities)
    modularity = round(nx.community.modularity(graph, communities), 6)
    title = f"Community Visualization of {len(communities)} communities with modularity of {modularity}"
    pos = nx.spring_layout(graph, k=0.3, iterations=50, seed=2)
    plt.subplot(3, 1, i)
    plt.title(title)
    nx.draw(
        graph,
        pos=pos,
        node_size=1000,
        node_color=node_colors,
        with_labels=True,
        font_size=20,
        font_color="black",
    )


fig, ax = plt.subplots(3, figsize=(15, 20))

# 根据社区着色绘制图表
visualize_communities(G, communities[0], 1)
visualize_communities(G, communities[3], 2)

# 绘制重要边被移除时模块度变化的情况
modularity_df.plot.bar(
    x="k",
    ax=ax[2],
    color="#F2D140",
    title="Modularity Trend for Girvan-Newman Community Detection",
)
plt.show()
Total running time of the script: (0 minutes 0.458 seconds)
