Note
Go to the end to download the full example code.
通过谱图划分进行图像分割#
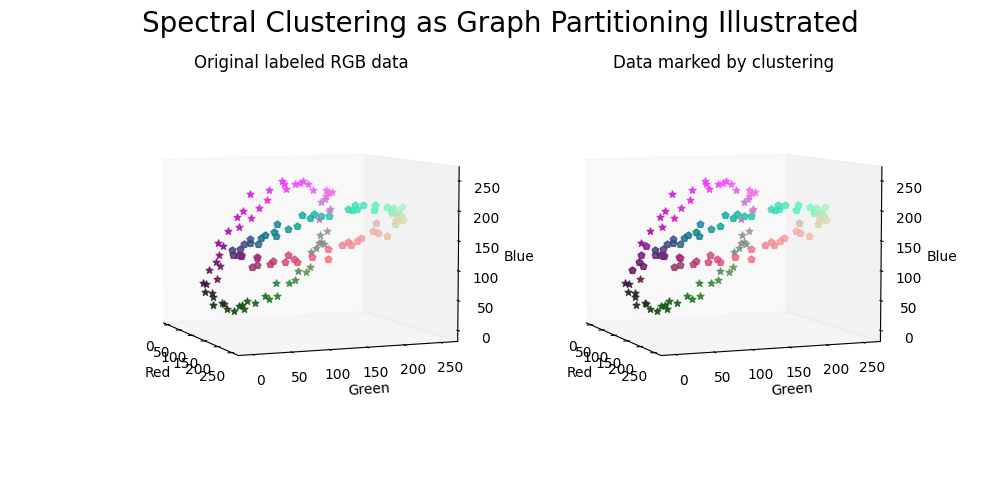
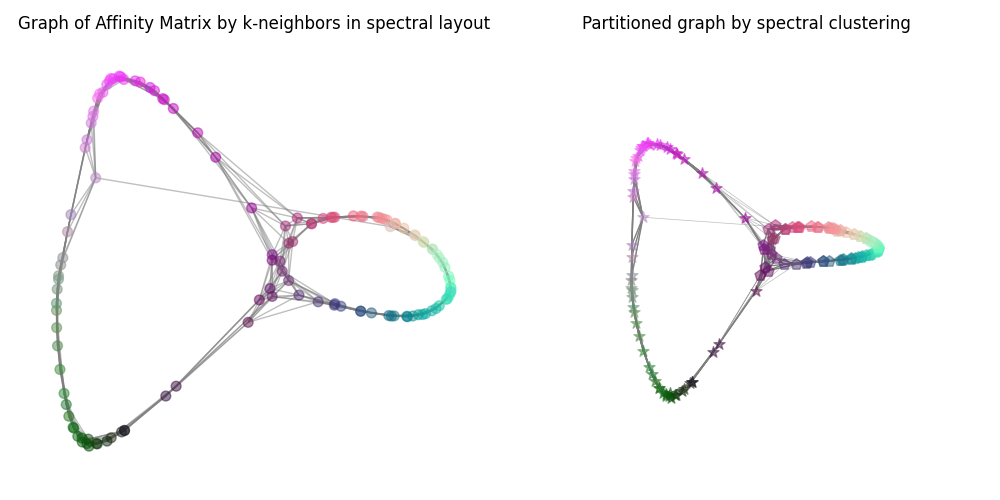
通过``k-neighbors``从RGB图像中获得的无向图进行谱聚类分割成两个子图的示例, 通过在RGB 3D空间中原始标记数据点的3D图与通过谱聚类进行图分割执行的双分区标记进行对比展示。 所有3D图均使用3D谱布局。
有关如何从这些可视化中创建3D动画的配方,请参阅 3D Drawing。
import numpy as np
import networkx as nx
import matplotlib.pyplot as plt
from matplotlib import animation
from matplotlib.lines import Line2D
from sklearn.cluster import SpectralClustering

# sphinx_gallery_thumbnail_number = 3
创建一个示例三维数据集 “The Rings”。#
该数据集由两个在三维空间中纠缠的噪声环组成。
np.random.seed(0)
N_SAMPLES = 128
X = np.random.random((N_SAMPLES, 3)) * 5e-1
m = int(np.round(N_SAMPLES / 2))
theta = np.linspace(0, 2 * np.pi, m)
X[0:m, 0] += 2 * np.cos(theta)
X[0:m, 1] += 3 * np.sin(theta) + 1
X[0:m, 2] += np.sin(theta) + 0.5
X[m:, 0] += 2 * np.sin(theta)
X[m:, 1] += 2 * np.cos(theta) - 1
X[m:, 2] += 3 * np.sin(theta)
Y = np.zeros(N_SAMPLES, dtype=np.int8)
Y[m:] = np.ones(m, dtype=np.int8)

# 将X映射为int8类型,以便进行8位RGB解释用于绘图
for i in np.arange(X.shape[1]):
    x = X[:, i]
    min_x = np.min(x)
    max_x = np.max(x)
    X[:, i] = np.round(255 * (x - min_x) / (max_x - min_x))
将RGB数据集绘制为图像。#
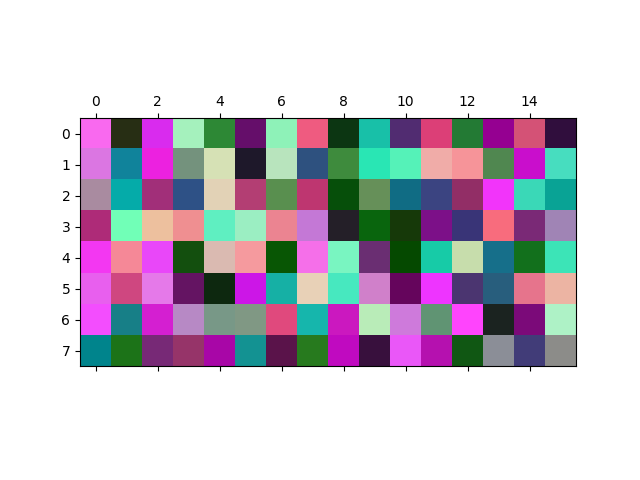
每个128个三维数据点可以被视为一个像素的RGB值。 我们将数据集绘制为一张8x16像素的图像, 将像素随机放置在8x16的网格中。 数据中的精细结构在图像中无法直观检测到。
perm = np.random.permutation(X.shape[0])
rgb_array = X[perm, :].reshape(8, 16, 3).astype(int)
fig, ax = plt.subplots()
ax.matshow(rgb_array)
plt.show()

生成图并确定两个聚类。#
使用“最近邻”方法构建图,并生成两个聚类 由谱聚类/图划分确定。
NUM_CLUSTERS = 2
sc = SpectralClustering(
    n_clusters=NUM_CLUSTERS,
    affinity="nearest_neighbors",
    random_state=4242,
    n_neighbors=10,
    assign_labels="cluster_qr",
    n_jobs=-1,
)
clusters = sc.fit(X)
cluster_affinity_matrix = clusters.affinity_matrix_.getH()

pred_labels = clusters.labels_.astype(int)
G = nx.from_scipy_sparse_array(cluster_affinity_matrix)
# remove self edges
G.remove_edges_from(nx.selfloop_edges(G))

cluser_member = []
for u in G.nodes:
    cluser_member.append(pred_labels[u])
生成数据的图表。#
数据点根据原始标签进行标记(左侧面板) 并通过聚类(右侧面板)。
def _scatter_plot(ax, X, array_of_markers, axis_plot=True):
    # `marker` 参数不支持列表或数组格式,需要一个循环
    for i, marker in enumerate(array_of_markers):
        ax.scatter(
            X[i, 0],
            X[i, 1],
            X[i, 2],
            s=26,
            marker=marker,
            alpha=0.8,
            color=tuple(X[i] / 255),
        )
    if axis_plot == True:
        ax.set_xlabel("Red")
        ax.set_ylabel("Green")
        ax.set_zlabel("Blue")
    else:
        ax.set_axis_off()
    ax.grid(False)
    ax.view_init(elev=6.0, azim=-22.0)


# 选择标记列表的后半部分以提高可见性
list_of_markers = Line2D.filled_markers[len(Line2D.filled_markers) // 2 :]

fig = plt.figure(figsize=(10, 5))
fig.suptitle("Spectral Clustering as Graph Partitioning Illustrated", fontsize=20)

ax0 = fig.add_subplot(1, 2, 1, projection="3d")
ax0.set_title("Original labeled RGB data")
array_of_markers = np.array(list_of_markers)[Y.astype(int)]
_scatter_plot(ax0, X, array_of_markers)

ax1 = fig.add_subplot(1, 2, 2, projection="3d")
ax1.set_title("Data marked by clustering")
array_of_markers = np.array(list_of_markers)[pred_labels.astype(int)]
_scatter_plot(ax1, X, array_of_markers)

plt.show()

生成图表的绘图。#
图的节点根据聚类进行标记。
# 从谱聚类获取亲和矩阵
weights = [d["weight"] for u, v, d in G.edges(data=True)]

fig = plt.figure(figsize=(10, 5))
ax0 = fig.add_subplot(1, 2, 1)
ax0.set_title("Graph of Affinity Matrix by k-neighbors in spectral layout")
pos = nx.spectral_layout(G)
nx.draw_networkx(
    G,
    pos=pos,
    alpha=0.5,
    node_size=50,
    with_labels=False,
    ax=ax0,
    node_color=X / 255,
    edge_color="Grey",
)
plt.box(False)
ax0.grid(False)
ax0.set_axis_off()

ax1 = fig.add_subplot(1, 2, 2, projection="3d")
ax1.set_title("Partitioned graph by spectral clustering")
pos = nx.spectral_layout(G, dim=3)
nodes = np.array([pos[v] for v in G])
edges = np.array([(pos[u], pos[v]) for u, v in G.edges()])
point_size = int(800 / np.sqrt(len(nodes)))


def _3d_graph_plot(ax):
    for i, marker in enumerate(array_of_markers):
        ax.scatter(
            *nodes[i].T,
            s=point_size,
            color=tuple(X[i] / 255),
            marker=marker,
            alpha=0.5,
        )
    for vizedge, weight in zip(edges, weights):
        ax.plot(*vizedge.T, color="tab:gray", linewidth=weight, alpha=weight)
    ax.view_init(elev=100.0, azim=-100.0)
    ax.grid(False)
    ax.set_axis_off()


_3d_graph_plot(ax1)
plt.tight_layout()
plt.show()

Total running time of the script: (0 minutes 1.421 seconds)
