Note
Go to the end to download the full example code.
最低共同祖先#
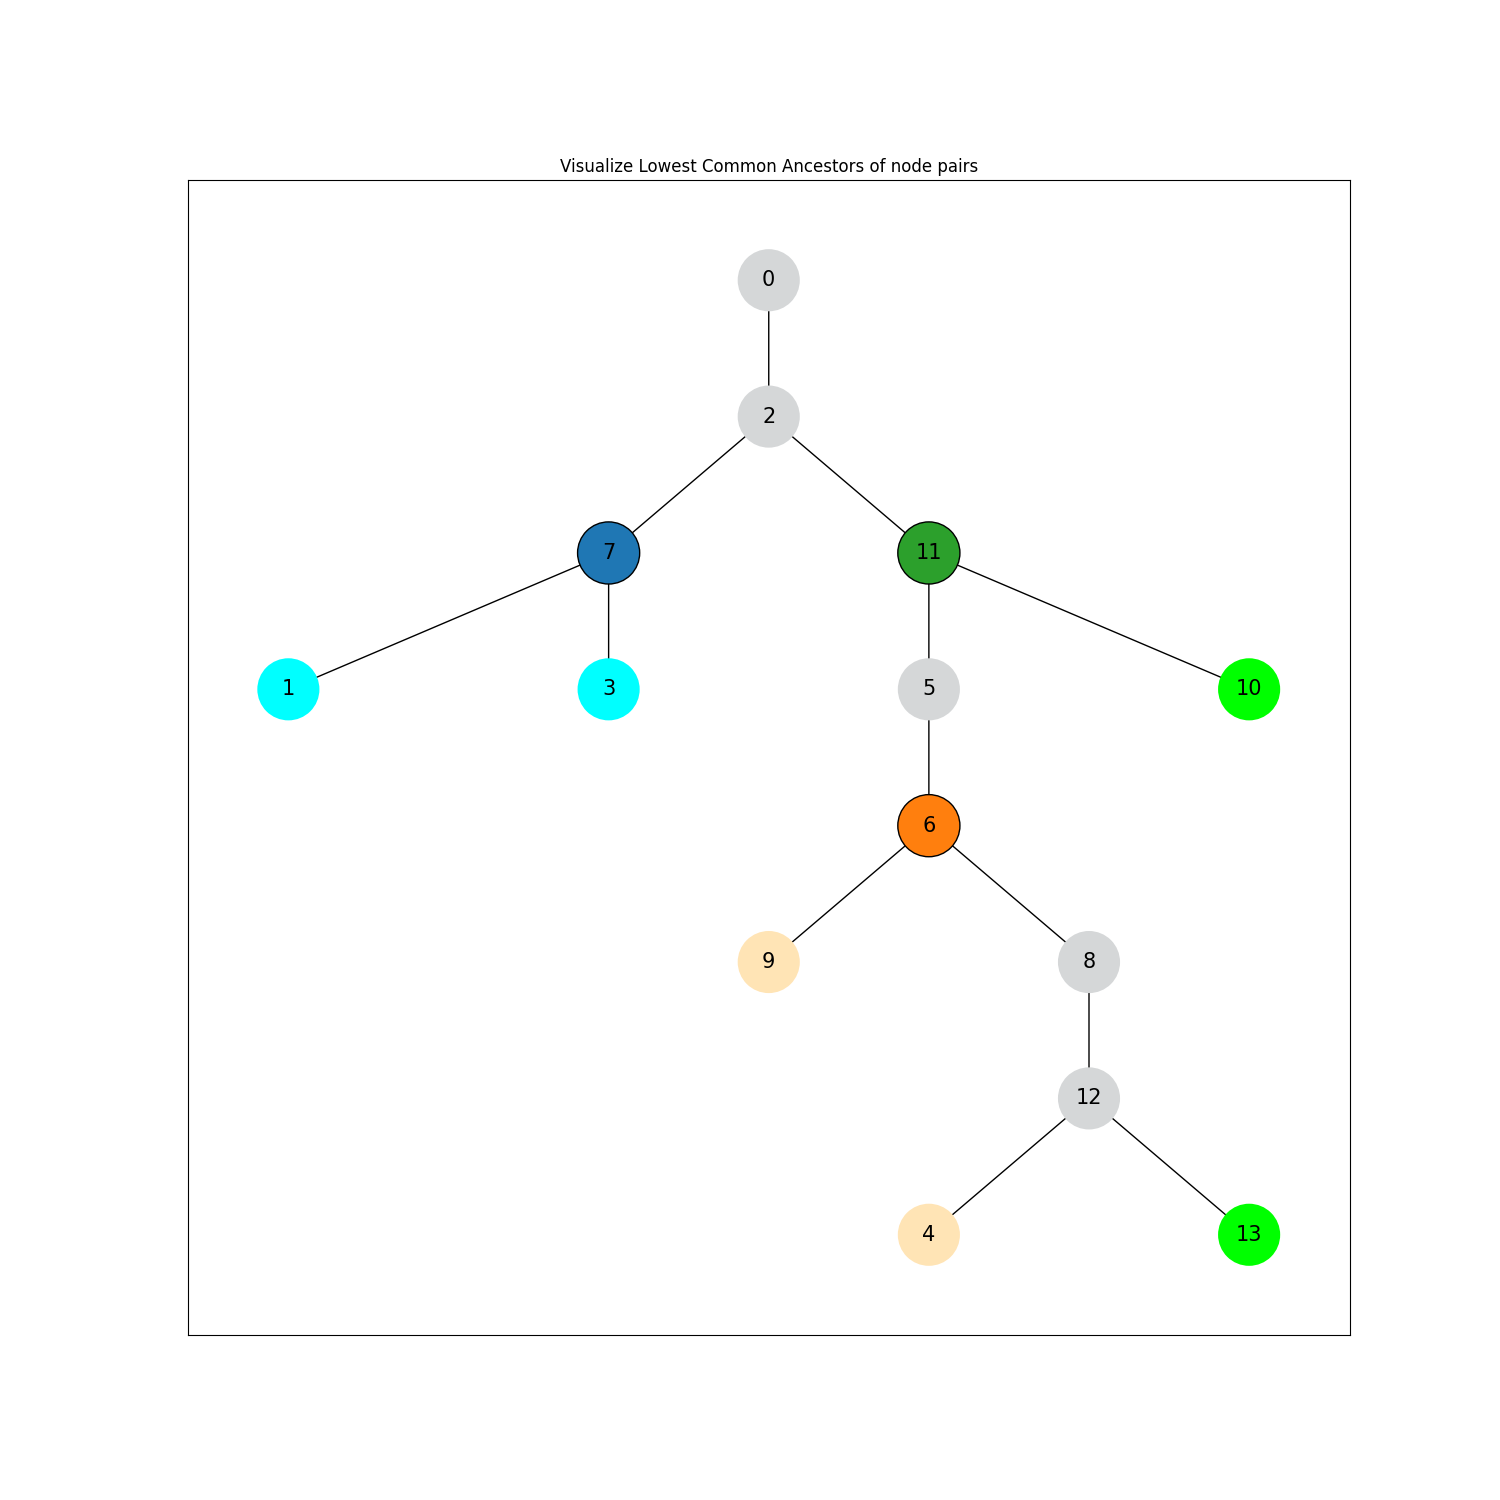
计算并可视化节点对的LCA
在一个随机生成的有向树中,计算某些节点对的最低共同祖先。这些节点对及其LCA随后会以选定的颜色方案进行可视化。

import networkx as nx
import matplotlib.pyplot as plt

G = nx.DiGraph(
    [
        (0, 2),
        (2, 7),
        (2, 11),
        (5, 6),
        (6, 9),
        (6, 8),
        (7, 1),
        (7, 3),
        (8, 12),
        (11, 10),
        (11, 5),
        (12, 4),
        (12, 13),
    ]
)
pos = nx.nx_agraph.graphviz_layout(G, prog="dot")

# 计算某些节点对的最小公共祖先
ancestors = list(nx.all_pairs_lowest_common_ancestor(G, ((1, 3), (4, 9), (13, 10))))

# 创建节点颜色和边颜色列表
node_colors = ["#D5D7D8" for _ in G]
node_edge_colors = ["None" for _ in G]
node_seq = list(G.nodes)
clr_pairs = (("cyan", "tab:blue"), ("moccasin", "tab:orange"), ("lime", "tab:green"))
for (children, ancestor), (child_clr, anc_clr) in zip(ancestors, clr_pairs):
    for c in children:
        node_colors[node_seq.index(c)] = child_clr
    node_colors[node_seq.index(ancestor)] = anc_clr
    node_edge_colors[node_seq.index(ancestor)] = "black"

# Plot tree
plt.figure(figsize=(15, 15))
plt.title("Visualize Lowest Common Ancestors of node pairs")
nx.draw_networkx_nodes(
    G, pos, node_color=node_colors, node_size=2000, edgecolors=node_edge_colors
)
nx.draw_networkx_edges(G, pos)
nx.draw_networkx_labels(G, pos, font_size=15)
plt.show()
Total running time of the script: (0 minutes 0.119 seconds)