scipy.interpolate.RectSphereBivariateSpline.
事件#
- RectSphereBivariateSpline.ev(theta, phi, dtheta=0, dphi=0)[源代码]#
在点处评估样条
返回在
(theta[i], phi[i]), i=0,...,len(theta)-1处的插值结果。- 参数:
- theta, phiarray_like
输入坐标。遵循标准的 Numpy 广播规则。轴的顺序与 np.meshgrid(…, indexing=”ij”) 一致,与默认顺序 np.meshgrid(…, indexing=”xy”) 不一致。
- dthetaint, 可选
theta-导数的顺序
Added in version 0.14.0.
- dphiint, 可选
phi-导数的顺序
Added in version 0.14.0.
示例
假设我们想使用样条曲线来插值球面上的二元函数。该函数在经度和余纬度的网格上的值是已知的。
>>> import numpy as np
>>> from scipy.interpolate import RectSphereBivariateSpline
>>> def f(theta, phi):
...     return np.sin(theta) * np.cos(phi)
我们在网格上评估函数。注意,meshgrid 的默认 indexing=”xy” 会在插值后导致意外的(转置的)结果。
>>> thetaarr = np.linspace(0, np.pi, 22)[1:-1]
>>> phiarr = np.linspace(0, 2 * np.pi, 21)[:-1]
>>> thetagrid, phigrid = np.meshgrid(thetaarr, phiarr, indexing="ij")
>>> zdata = f(thetagrid, phigrid)
接下来,我们设置插值器,并使用它在原始网格外的点上评估函数。
>>> rsbs = RectSphereBivariateSpline(thetaarr, phiarr, zdata)
>>> thetainterp = np.linspace(thetaarr[0], thetaarr[-1], 200)
>>> phiinterp = np.linspace(phiarr[0], phiarr[-1], 200)
>>> zinterp = rsbs.ev(thetainterp, phiinterp)
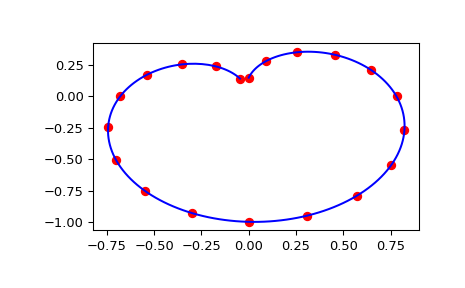
最后,我们绘制通过初始网格对角切片的原始数据,以及沿同一对角切片的样条近似。
>>> import matplotlib.pyplot as plt
>>> fig = plt.figure()
>>> ax1 = fig.add_subplot(1, 1, 1)
>>> ax1.plot(np.sin(thetaarr) * np.sin(phiarr), np.diag(zdata), "or")
>>> ax1.plot(np.sin(thetainterp) * np.sin(phiinterp), zinterp, "-b")
>>> plt.show()
