最小相位#
- scipy.signal.minimum_phase(h, method='homomorphic', n_fft=None, *, half=True)[源代码][源代码]#
将线性相位FIR滤波器转换为最小相位
- 参数:
- h数组
线性相位 FIR 滤波器系数。
- 方法{‘希尔伯特’, ‘同态’}
提供的方法有:
- n_fft整数
用于FFT的点数。应至少比信号长度大几倍(参见注释)。
- 一半布尔
如果
True,创建一个长度为原始长度一半的滤波器,其幅度谱为原始幅度谱的平方根。如果False,创建一个与原始长度相同的滤波器,其幅度谱设计为匹配原始幅度谱(仅在method='homomorphic'时支持)。Added in version 1.14.0.
- 返回:
- h_minimum数组
滤波器的最小相位版本,当
half 为 True时长度为(len(h) + 1) // 2,否则为len(h)。
注释
Hilbert [1] 或同态 [4] [5] 方法都需要选择一个FFT长度来估计滤波器的复倒谱。
在Hilbert方法的情况下,与理想频谱
epsilon的偏差与阻带零点的数量n_stop和FFT长度n_fft有关,如下:epsilon = 2. * n_stop / n_fft
例如,如果有100个阻带零点和2048的FFT长度,
epsilon = 0.0976。如果我们保守地假设阻带零点的数量比滤波器长度少一个,我们可以将FFT长度设为满足``epsilon=0.01``的下一个2的幂,如下:n_fft = 2 ** int(np.ceil(np.log2(2 * (len(h) - 1) / 0.01)))
这为Hilbert方法和同态方法都提供了合理的结果,并且在
n_fft=None时给出了使用的值。存在多种创建最小相位滤波器的替代实现方法,包括零反转 [2] 和谱分解 [3] [4]。更多信息请参见 DSPGuru 页面。
参考文献
[1] (1,2)N. Damera-Venkata and B. L. Evans, “Optimal design of real and complex minimum phase digital FIR filters,” Acoustics, Speech, and Signal Processing, 1999. Proceedings., 1999 IEEE International Conference on, Phoenix, AZ, 1999, pp. 1145-1148 vol.3. DOI:10.1109/ICASSP.1999.756179
[2]X. Chen and T. W. Parks, “Design of optimal minimum phase FIR filters by direct factorization,” Signal Processing, vol. 10, no. 4, pp. 369-383, Jun. 1986.
[3]T. Saramaki, “Finite Impulse Response Filter Design,” in Handbook for Digital Signal Processing, chapter 4, New York: Wiley-Interscience, 1993.
示例
创建一个具有 [0.2, 0.3] 过渡带的最优线性相位低通滤波器 `h`(假设奈奎斯特频率为 1):
>>> import numpy as np
>>> from scipy.signal import remez, minimum_phase, freqz, group_delay
>>> import matplotlib.pyplot as plt
>>> freq = [0, 0.2, 0.3, 1.0]
>>> desired = [1, 0]
>>> h_linear = remez(151, freq, desired, fs=2)
转换为最小相位:
>>> h_hil = minimum_phase(h_linear, method='hilbert')
>>> h_hom = minimum_phase(h_linear, method='homomorphic')
>>> h_hom_full = minimum_phase(h_linear, method='homomorphic', half=False)
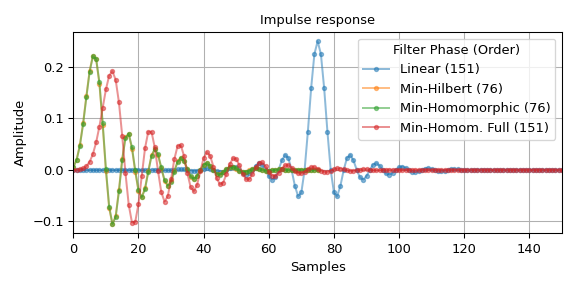
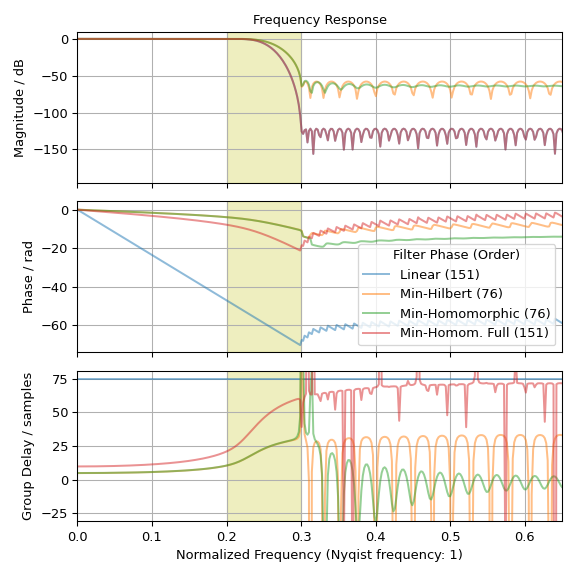
比较四个滤波器的脉冲响应和频率响应:
>>> fig0, ax0 = plt.subplots(figsize=(6, 3), tight_layout=True)
>>> fig1, axs = plt.subplots(3, sharex='all', figsize=(6, 6), tight_layout=True)
>>> ax0.set_title("Impulse response")
>>> ax0.set(xlabel='Samples', ylabel='Amplitude', xlim=(0, len(h_linear) - 1))
>>> axs[0].set_title("Frequency Response")
>>> axs[0].set(xlim=(0, .65), ylabel="Magnitude / dB")
>>> axs[1].set(ylabel="Phase / rad")
>>> axs[2].set(ylabel="Group Delay / samples", ylim=(-31, 81),
...             xlabel='Normalized Frequency (Nyqist frequency: 1)')
>>> for h, lb in ((h_linear,   f'Linear ({len(h_linear)})'),
...               (h_hil,      f'Min-Hilbert ({len(h_hil)})'),
...               (h_hom,      f'Min-Homomorphic ({len(h_hom)})'),
...               (h_hom_full, f'Min-Homom. Full ({len(h_hom_full)})')):
...     w_H, H = freqz(h, fs=2)
...     w_gd, gd = group_delay((h, 1), fs=2)
...
...     alpha = 1.0 if lb == 'linear' else 0.5  # full opacity for 'linear' line
...     ax0.plot(h, '.-', alpha=alpha, label=lb)
...     axs[0].plot(w_H, 20 * np.log10(np.abs(H)), alpha=alpha)
...     axs[1].plot(w_H, np.unwrap(np.angle(H)), alpha=alpha, label=lb)
...     axs[2].plot(w_gd, gd, alpha=alpha)
>>> ax0.grid(True)
>>> ax0.legend(title='Filter Phase (Order)')
>>> axs[1].legend(title='Filter Phase (Order)', loc='lower right')
>>> for ax_ in axs:  # shade transition band:
...     ax_.axvspan(freq[1], freq[2], color='y', alpha=.25)
...     ax_.grid(True)
>>> plt.show()


脉冲响应和群延迟图描绘了线性相位滤波器 h 的 75 样本延迟。由于幅度较小,数值噪声在阻带中也应呈现线性相位。此外,图表显示最小相位滤波器在通带和过渡带中明显表现出减少(负)的相位斜率。图表还说明,参数为
method='homomorphic', half=False的滤波器与线性滤波器 h 具有相同的阶数和幅度响应,而其他最小相位滤波器只有一半的阶数和幅度响应的平方根。