3D 图表报告
3d_plots_reporting.py 示例展示了如何将一系列数据报告为表面图和3D散点图。
当脚本运行时,它会在examples项目中创建一个名为3D plot reporting的实验。
ClearML 在实验的 PLOTS 标签中报告这些图表。
表面图
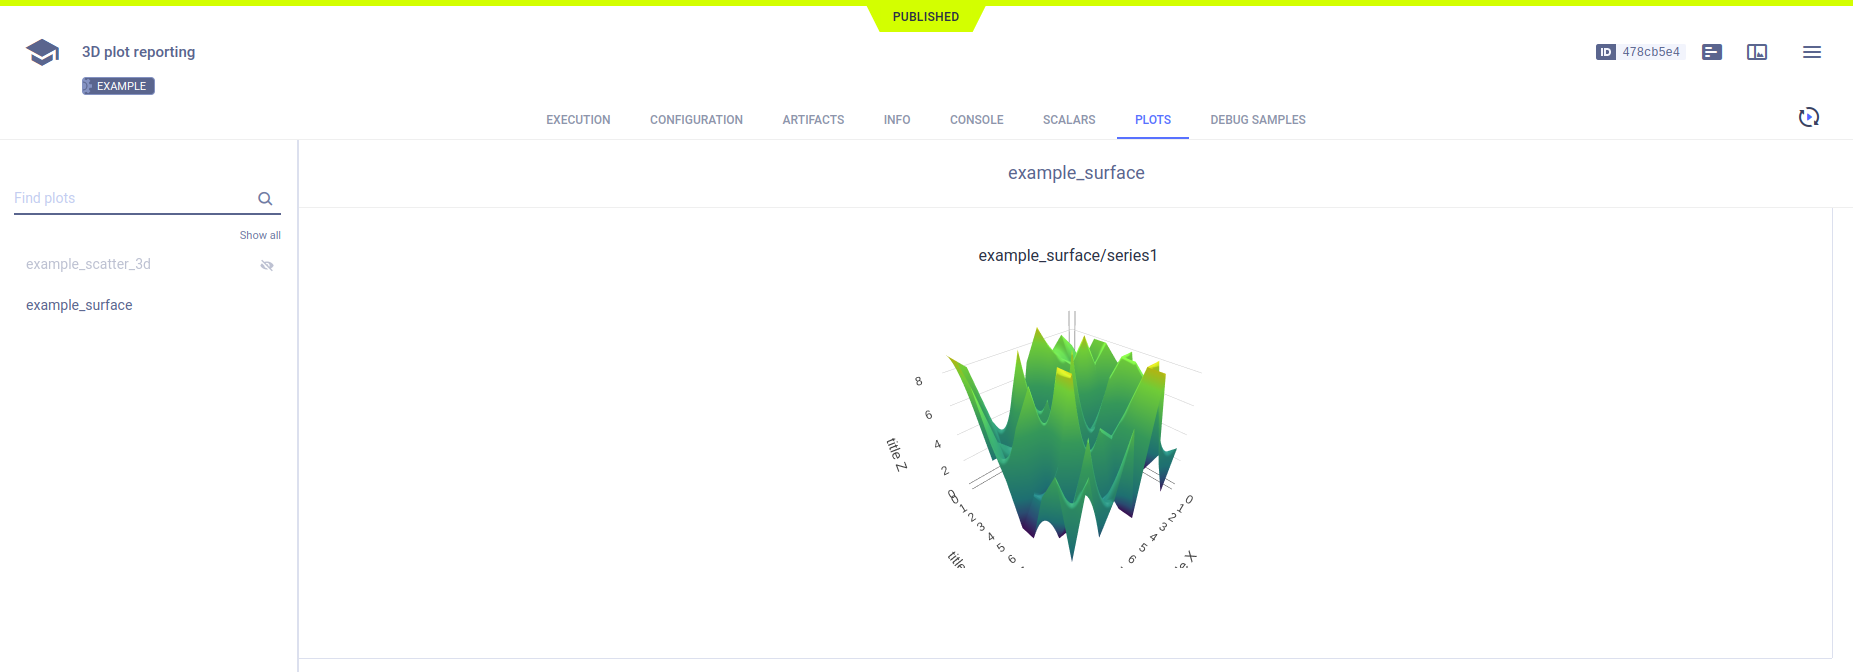
要将系列绘制为曲面图,请使用 Logger.report_surface():
# report 3d surface
surface = np.random.randint(10, size=(10, 10))
Logger.current_logger().report_surface(
    title="example_surface",
    series="series1",
    iteration=iteration,
    matrix=surface,
    xaxis="title X",
    yaxis="title Y",
    zaxis="title Z",
)
在PLOTS中查看报告的表面图。

3D 散点图
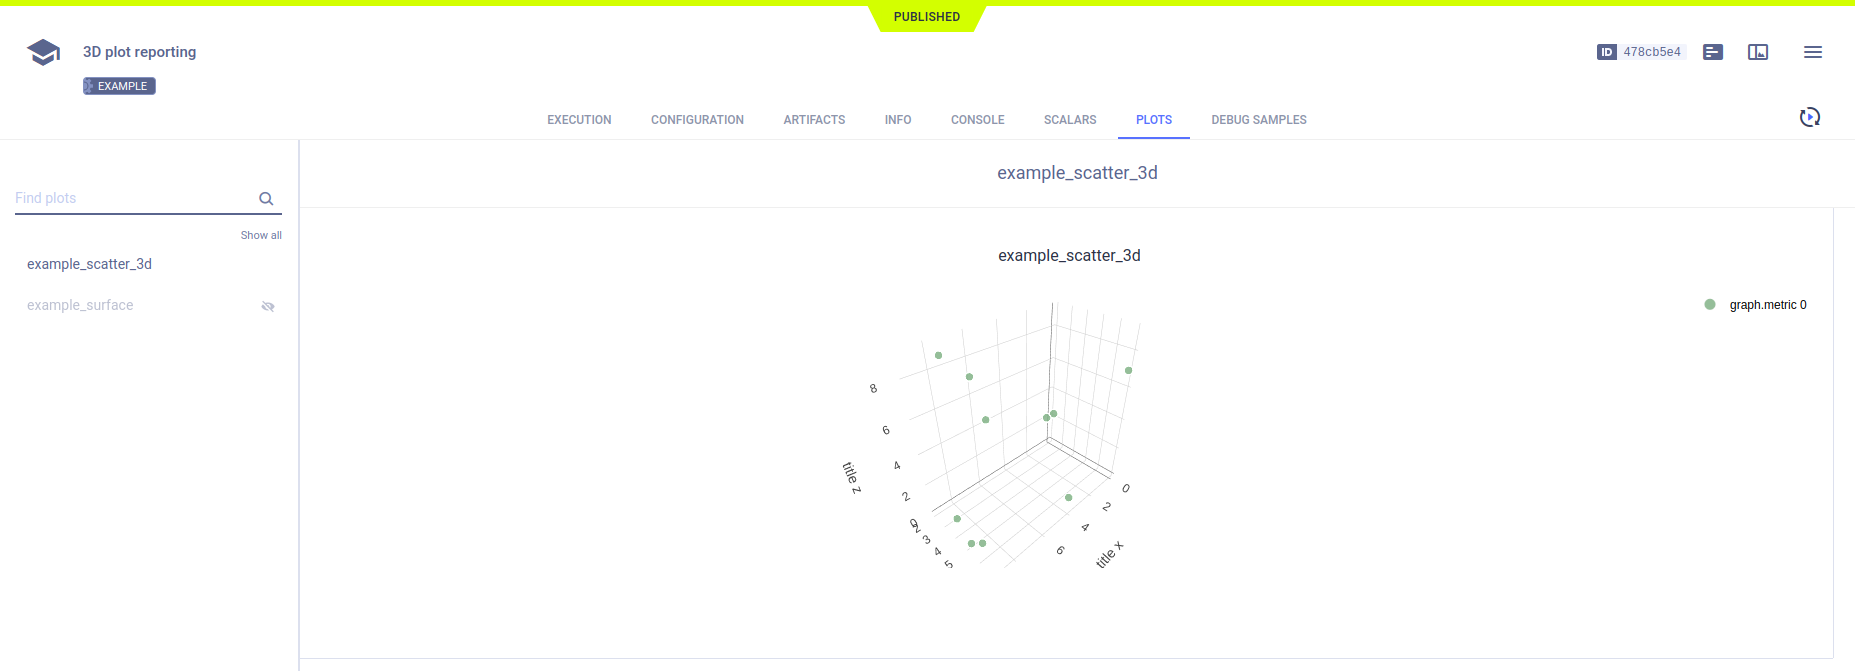
要将系列绘制为3D散点图,请使用Logger.report_scatter3d():
# report 3d scatter plot
scatter3d = np.random.randint(10, size=(10, 3))
Logger.current_logger().report_scatter3d(
    title="example_scatter_3d",
    series="series_xyz",
    iteration=iteration,
    scatter=scatter3d,
    xaxis="title x",
    yaxis="title y",
    zaxis="title z",
)
在PLOTS中查看报告的3D散点图。
