Plotly 报告
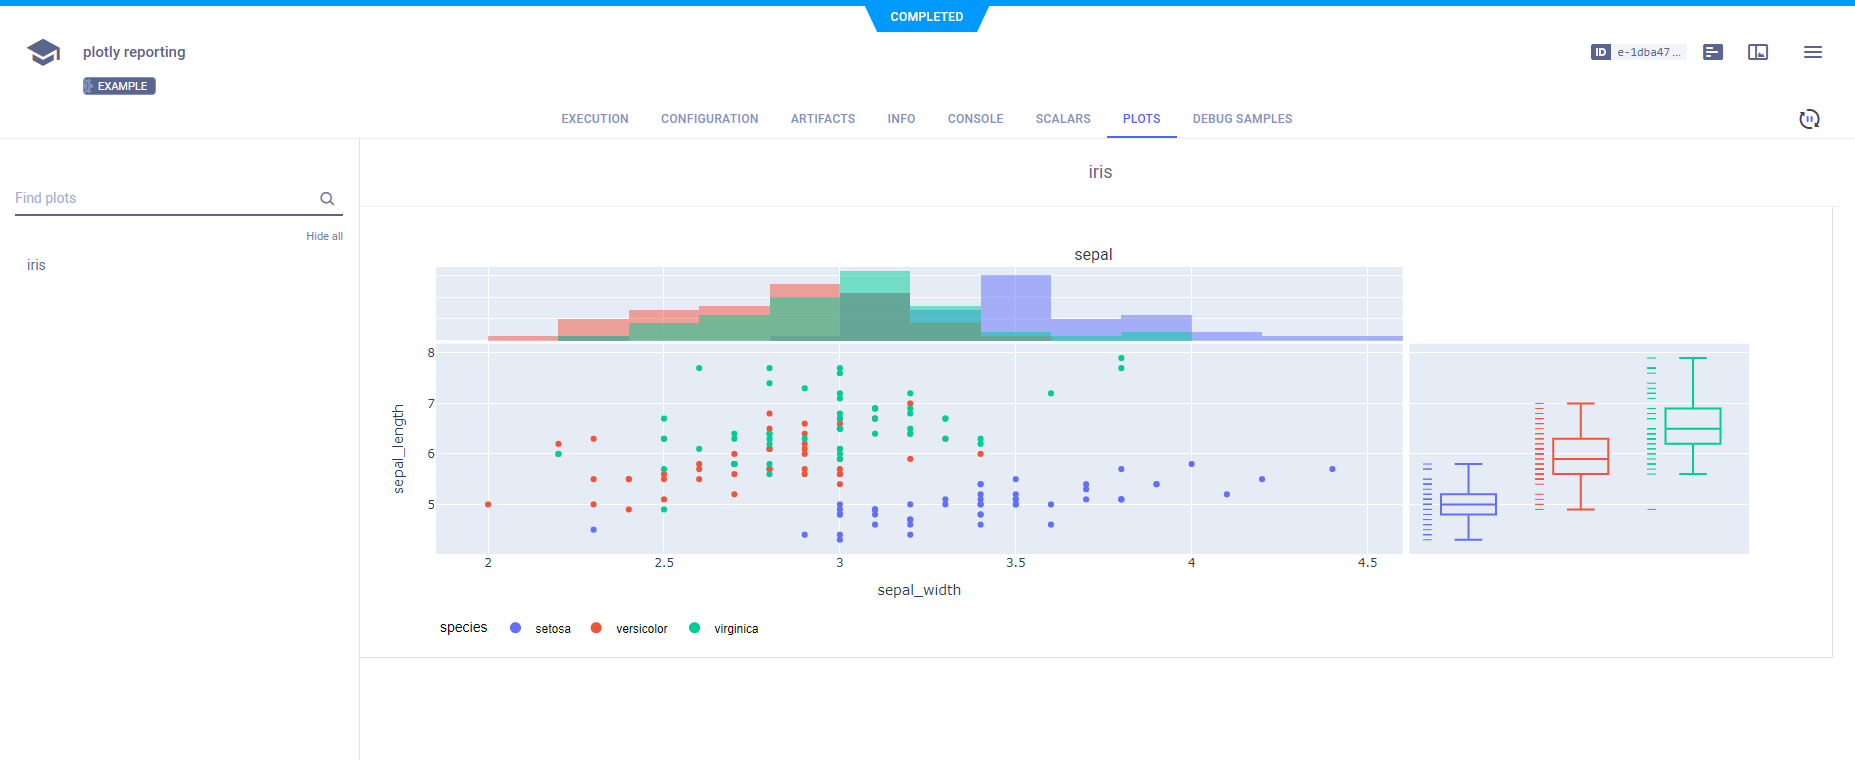
plotly_reporting.py 示例 展示了 ClearML 的 Plotly 集成和报告功能。
通过调用Logger.report_plotly()方法,并使用figure参数传递一个复杂的Plotly图表,可以在ClearML中报告Plotly图表。
在这个例子中,Plotly图表是使用plotly.express.scatter创建的(参见Plotly文档):
# Iris dataset
df = px.data.iris()

# create complex plotly figure
fig = px.scatter(
    df,
    x="sepal_width",
    y="sepal_length",
    color="species",
    marginal_y="rug",
    marginal_x="histogram"
)

# report the plotly figure
task.get_logger().report_plotly(
    title="iris", series="sepal", iteration=0, figure=fig
)
当脚本运行时,它会在示例项目中创建一个名为plotly reporting的实验。
ClearML 报告 Plotly 图表,并在 ClearML Web UI > 实验详情 > 图表 标签中显示它们。
