2D 图表报告
scatter_hist_confusion_mat_reporting.py 示例展示了以下2D格式的系列数据报告:
ClearML 在 ClearML Web UI 中报告这些表格,实验详情 > 图表 标签。
当脚本运行时,它会在examples项目中创建一个名为2D plots reporting的实验。
直方图
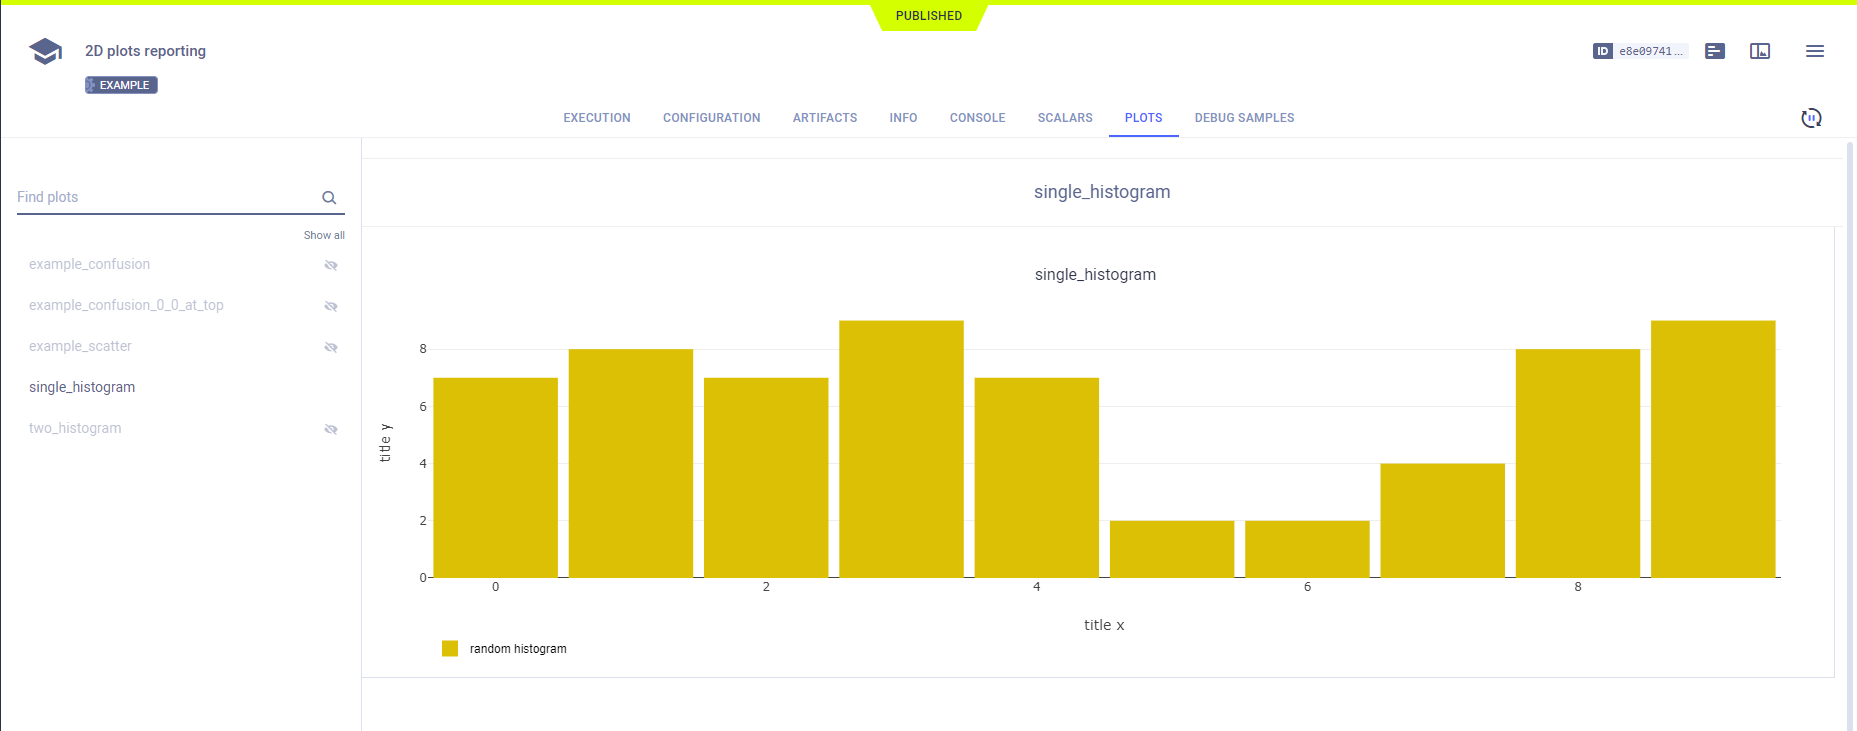
通过调用Logger.report_histogram()来报告直方图。
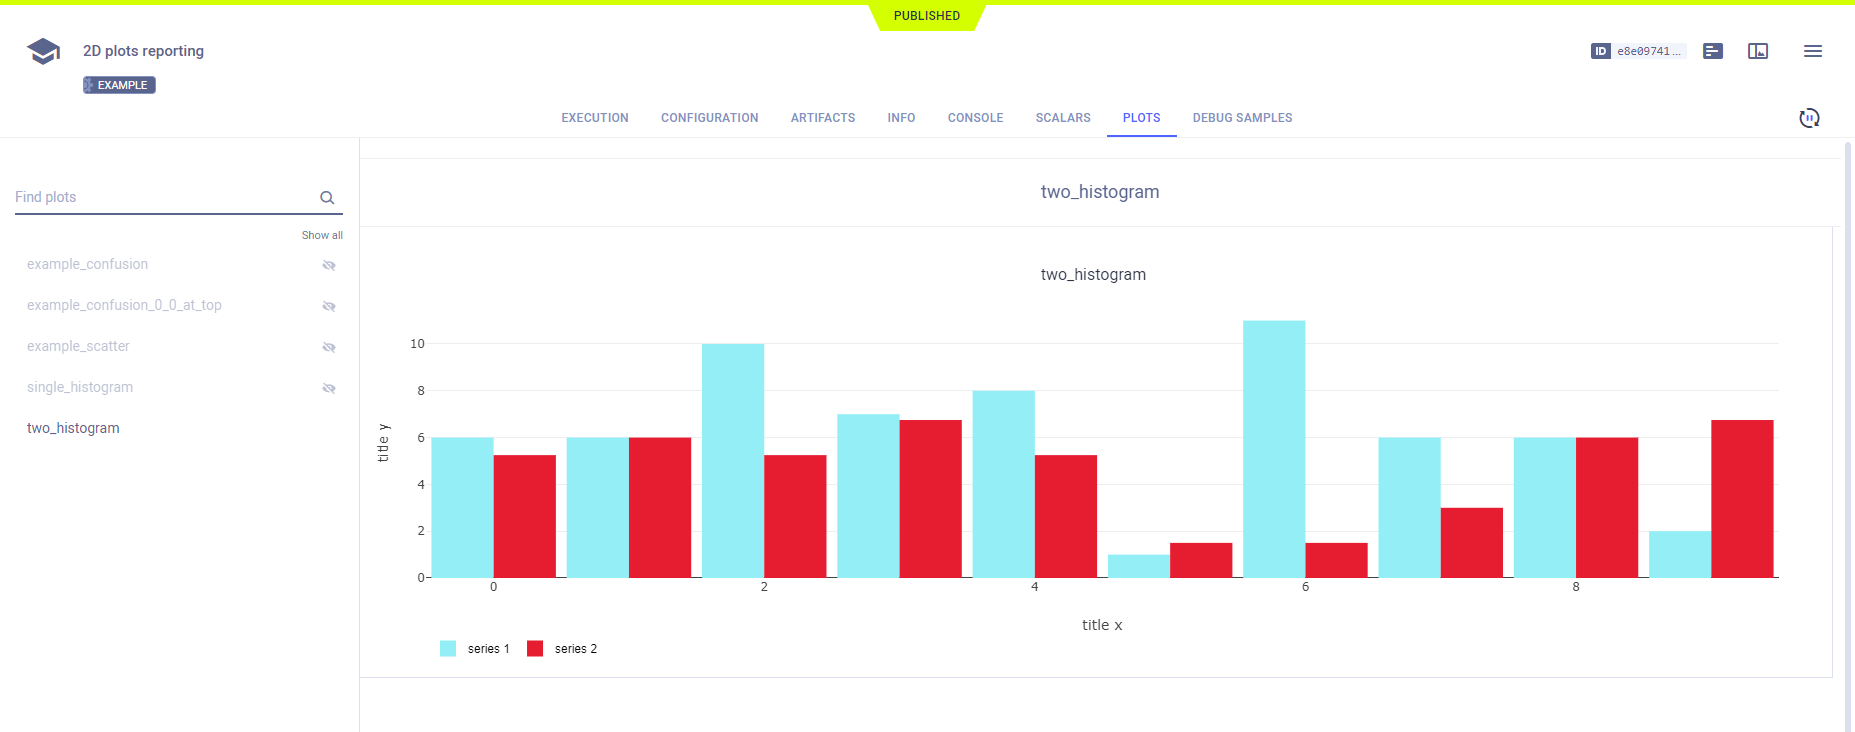
要在同一图表上报告多个系列,请使用相同的title参数。对于不同的图表,请使用不同的
title参数。使用mode参数指定直方图的类型。mode的值为group(默认)、
stack和relative。
# report a single histogram
histogram = np.random.randint(10, size=10)
Logger.current_logger().report_histogram(
    title="single_histogram",
    series="random histogram",
    iteration=iteration,
    values=histogram,
    xaxis="title x",
    yaxis="title y",
)

# report two histograms on the same graph (plot)
histogram1 = np.random.randint(13, size=10)
histogram2 = histogram * 0.75
Logger.current_logger().report_histogram(
    title="two_histogram",
    series="series 1",
    iteration=iteration,
    values=histogram1,
    xaxis="title x",
    yaxis="title y",
)

Logger.current_logger().report_histogram(
    "two_histogram",
    "series 2",
    iteration=iteration,
    values=histogram2,
    xaxis="title x",
    yaxis="title y",
)


混淆矩阵
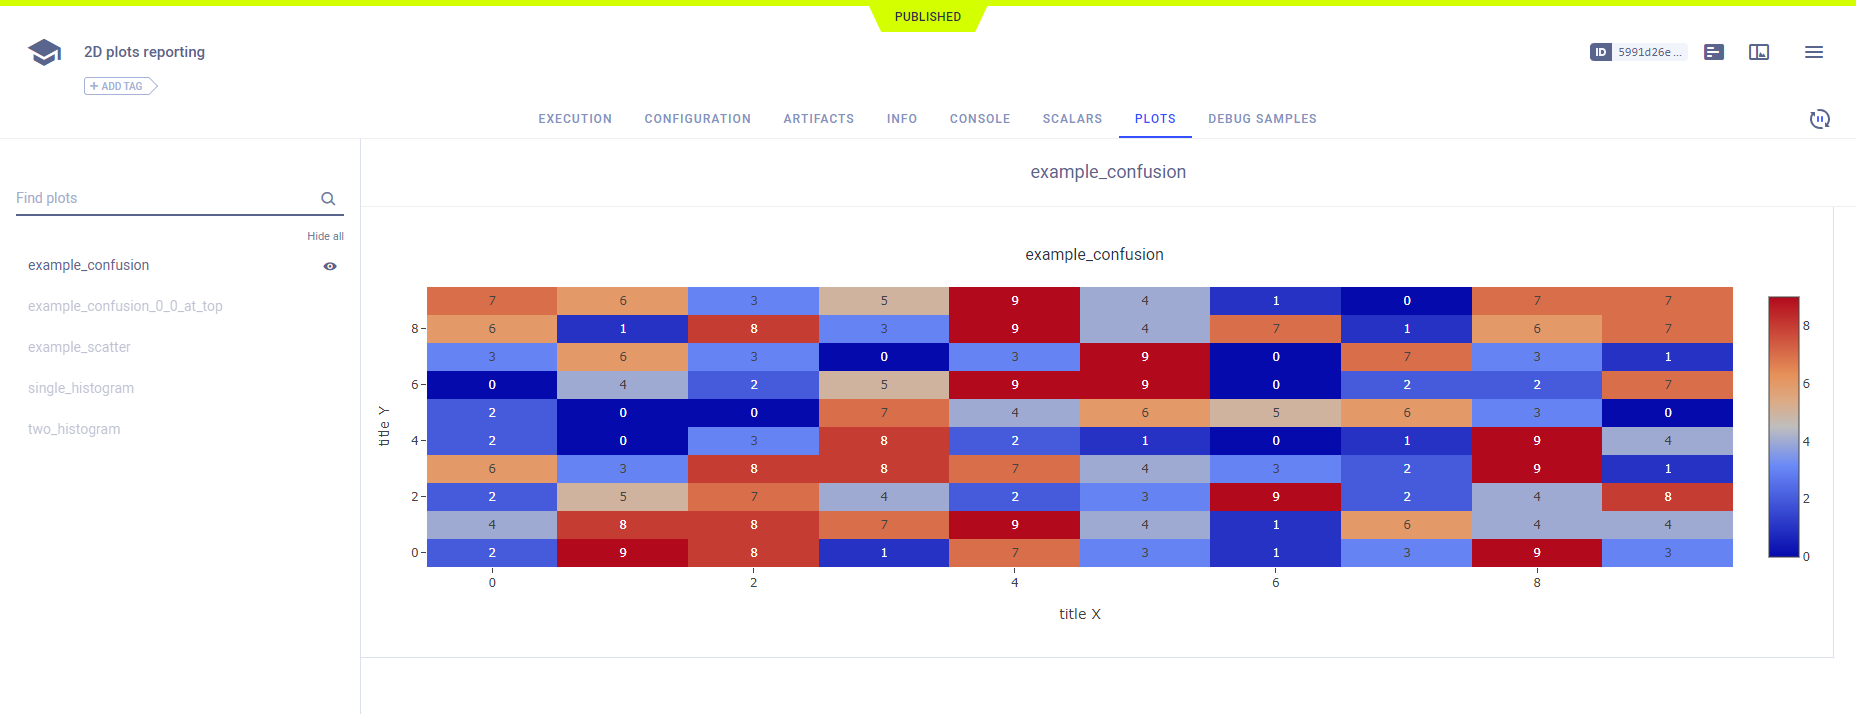
通过调用Logger.report_confusion_matrix()来报告混淆矩阵。
# report confusion matrix
confusion = np.random.randint(10, size=(10, 10))
Logger.current_logger().report_confusion_matrix(
    title="example_confusion",
    series="ignored",
    iteration=iteration,
    matrix=confusion,
    xaxis="title X",
    yaxis="title Y",
)

# report confusion matrix with 0,0 is at the top left
Logger.current_logger().report_confusion_matrix(
    title="example_confusion_0_0_at_top",
    series="ignored",
    iteration=iteration,
    matrix=confusion,
    xaxis="title X",
    yaxis="title Y",
    yaxis_reversed=True,
)
2D散点图
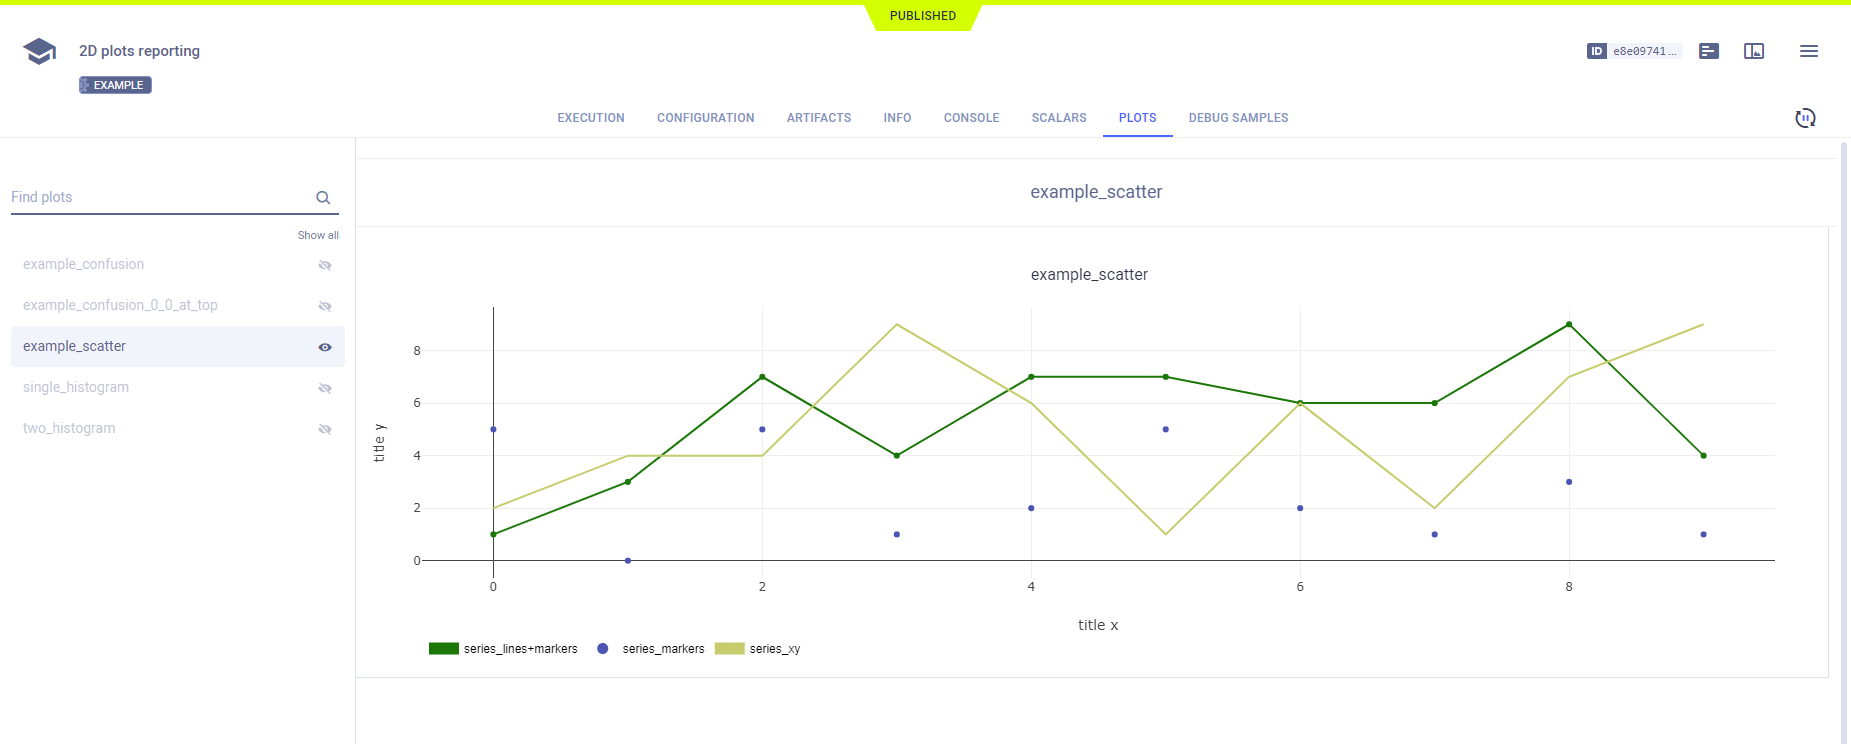
通过调用Logger.report_scatter2d()来报告2D散点图。
使用mode参数来绘制带有线条(默认情况下)、标记或同时带有线条和标记的数据点。
scatter2d = np.hstack(
    (np.atleast_2d(np.arange(0, 10)).T, np.random.randint(10, size=(10, 1)))
)

# report 2d scatter plot with lines
Logger.current_logger().report_scatter2d(
    title="example_scatter",
    series="series_xy",
    iteration=iteration,
    scatter=scatter2d,
    xaxis="title x",
    yaxis="title y",
)

# report 2d scatter plot with markers
Logger.current_logger().report_scatter2d(
    title="example_scatter",
    series="series_markers",
    iteration=iteration,
    scatter=scatter2d,
    xaxis="title x",
    yaxis="title y",
    mode='markers'
)

# report 2d scatter plot with lines and markers
Logger.current_logger().report_scatter2d(
    title="example_scatter",
    series="series_lines+markers",
    iteration=iteration,
    scatter=scatter2d,
    xaxis="title x",
    yaxis="title y",
    mode='lines+markers'
)
