Akima1DInterpolator#
- class scipy.interpolate.Akima1DInterpolator(x, y, axis=0, *, method='akima', extrapolate=None)[源代码][源代码]#
Akima 插值器
拟合分段三次多项式,给定向量 x 和 y。Akima 插值方法使用由分段三次多项式构建的连续可微子样条。生成的曲线通过给定的数据点,并且将显得平滑和自然。
- 参数:
- xndarray, 形状 (npoints, )
单调递增实数值的一维数组。
- yndarray, 形状 (…, npoints, …)
实数值的 N-D 数组。沿插值轴的
y的长度必须等于x的长度。使用axis参数选择插值轴。自 1.13.0 版本弃用: 复杂数据已被弃用,在 SciPy 1.15.0 中将引发错误。如果您尝试使用传递数组的实部,请在
y上使用np.real。- 轴int, 可选
y数组中对应于 x 坐标值的轴。默认为axis=0。- 方法{‘akima’, ‘makima’}, 可选
如果
"makima",使用修改后的 Akima 插值 [2]。默认为"akima",使用 Akima 插值 [1]。Added in version 1.13.0.
- 外推{bool, None}, 可选
如果是布尔值,决定是否根据第一个和最后一个区间外推到边界外的点,或者返回 NaN。如果为 None,
extrapolate设置为 False。
- 属性:
- 轴
- c
- 外推
- x
方法
__call__(x[, nu, extrapolate])评估分段多项式或其导数。
derivative([nu])构建一个新的分段多项式,表示导数。
antiderivative([nu])构建一个新的分段多项式,表示其反导数。
roots([discontinuity, extrapolate])找到分段多项式的实根。
参见
PchipInterpolatorPCHIP 1-D 单调三次插值器。
CubicSpline三次样条数据插值器。
PPoly以系数和断点表示的分段多项式
注释
Added in version 0.14.
仅用于精确数据,因为拟合曲线正好通过给定的点。此例程对于通过几个给定点绘制一条令人愉悦的平滑曲线以用于绘图目的非常有用。
设 \(\delta_i = (y_{i+1} - y_i) / (x_{i+1} - x_i)\) 为区间 \(\left[x_i, x_{i+1}\right)\) 的斜率。Akima 在 \(x_i\) 处的导数定义为:
\[d_i = \frac{w_1}{w_1 + w_2}\delta_{i-1} + \frac{w_2}{w_1 + w_2}\delta_i\]在Akima插值 [1] (
method="akima") 中,权重为:\[\begin{split}\begin{aligned} w_1 &= |\delta_{i+1} - \delta_i| \\ w_2 &= |\delta_{i-1} - \delta_{i-2}| \end{aligned}\end{split}\]在修改后的 Akima 插值 [2] (
method="makima") 中,为了消除过冲并避免分子和分母同时等于 0 的边缘情况,权重被修改如下:\[\begin{split}\begin{align*} w_1 &= |\delta_{i+1} - \delta_i| + |\delta_{i+1} + \delta_i| / 2 \\ w_2 &= |\delta_{i-1} - \delta_{i-2}| + |\delta_{i-1} + \delta_{i-2}| / 2 \end{align*}\end{split}\]参考文献
[1] (1,2)基于局部过程的新插值和平滑曲线拟合方法。Hiroshi Akima, J. ACM, 1970年10月, 17(4), 589-602. DOI:10.1145/321607.321609
[2] (1,2)Makima 分段三次插值。Cleve Moler 和 Cosmin Ionita,2019。https://blogs.mathworks.com/cleve/2019/04/29/makima-piecewise-cubic-interpolation/
示例
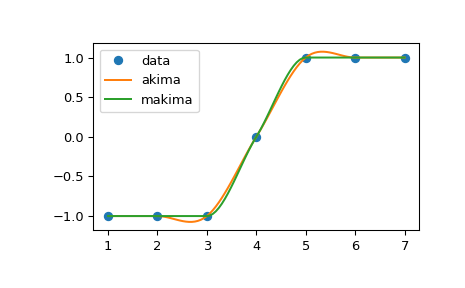
method="akima"和method="makima"的比较:>>> import numpy as np >>> from scipy.interpolate import Akima1DInterpolator >>> import matplotlib.pyplot as plt >>> x = np.linspace(1, 7, 7) >>> y = np.array([-1, -1, -1, 0, 1, 1, 1]) >>> xs = np.linspace(min(x), max(x), num=100) >>> y_akima = Akima1DInterpolator(x, y, method="akima")(xs) >>> y_makima = Akima1DInterpolator(x, y, method="makima")(xs)
>>> fig, ax = plt.subplots()
>>> ax.plot(x, y, "o", label="data")
>>> ax.plot(xs, y_akima, label="akima")
>>> ax.plot(xs, y_makima, label="makima")
>>> ax.legend()
>>> fig.show()
在
"akima"中出现的过冲问题在"makima"中得到了避免。