%%capture
!pip install hierarchicalforecast
!pip install -U statsforecast numba地理聚合(监狱人口)
澳大利亚监狱人口数据的地理层级预测
在许多应用中,一组时间序列是以层级方式组织的。示例包括定义不同类型聚合的地理层级、产品或类别。在这种情况下,预测者通常需要为所有分解和聚合系列提供预测。一个自然的愿望是这些预测能够“一致”,即底层系列的总和必须精确地对应于聚合系列的预测。
在本笔记本中,我们将展示如何使用HierarchicalForecast在地理层级之间生成一致的预测。我们将使用澳大利亚监狱人口数据集。
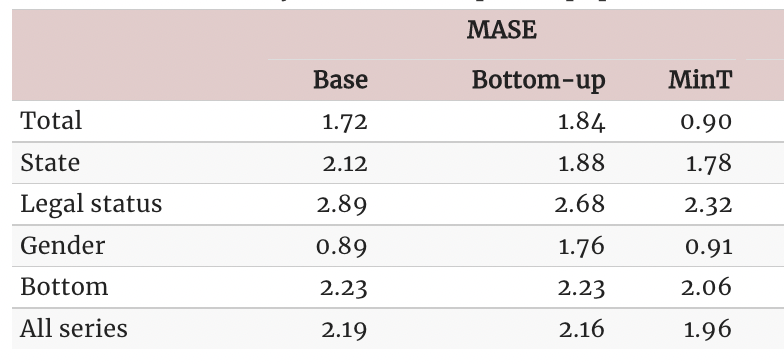
我们将首先加载数据集,并使用StatsForecast中的ETS模型生成基础预测,然后利用HierarchicalForecast中的几个调和算法对预测进行调和。最后,我们将展示其性能与预测:原理与实践中报告的结果相当,该结果使用了R包fable。
您可以使用 CPU 或 GPU 在 Google Colab 中运行这些实验。
1. 加载和处理数据
该数据集仅包含最低层级的时间序列,因此我们需要为所有层级创建时间序列。
import numpy as np
import pandas as pd
Y_df = pd.read_csv('https://OTexts.com/fpp3/extrafiles/prison_population.csv')
Y_df = Y_df.rename({'Count': 'y', 'Date': 'ds'}, axis=1)
Y_df.insert(0, 'Country', 'Australia')
Y_df = Y_df[['Country', 'State', 'Gender', 'Legal', 'Indigenous', 'ds', 'y']]
Y_df['ds'] = pd.to_datetime(Y_df['ds'])
Y_df.head()| Country | State | Gender | Legal | Indigenous | ds | y | |
|---|---|---|---|---|---|---|---|
| 0 | Australia | ACT | Female | Remanded | ATSI | 2005-03-01 | 0 |
| 1 | Australia | ACT | Female | Remanded | Non-ATSI | 2005-03-01 | 2 |
| 2 | Australia | ACT | Female | Sentenced | ATSI | 2005-03-01 | 0 |
| 3 | Australia | ACT | Female | Sentenced | Non-ATSI | 2005-03-01 | 5 |
| 4 | Australia | ACT | Male | Remanded | ATSI | 2005-03-01 | 7 |
数据集可以以以下分组结构进行分组。
hiers = [
    ['Country'],
    ['Country', 'State'],
    ['Country', 'Gender'],
    ['Country', 'Legal'],
    ['Country', 'State', 'Gender', 'Legal']
]
使用 HierarchicalForecast 中的 aggregate 函数,我们可以获得完整的时间序列集合。
from hierarchicalforecast.utils import aggregate%%capture
Y_df, S_df, tags = aggregate(Y_df, hiers)
Y_df['y'] = Y_df['y']/1e3
Y_df = Y_df.reset_index()Y_df.head()| unique_id | ds | y | |
|---|---|---|---|
| 0 | Australia | 2005-03-01 | 24.296 |
| 1 | Australia | 2005-06-01 | 24.643 |
| 2 | Australia | 2005-09-01 | 24.511 |
| 3 | Australia | 2005-12-01 | 24.393 |
| 4 | Australia | 2006-03-01 | 24.524 |
S_df.iloc[:5, :5]| Australia/ACT/Female/Remanded | Australia/ACT/Female/Sentenced | Australia/ACT/Male/Remanded | Australia/ACT/Male/Sentenced | Australia/NSW/Female/Remanded | |
|---|---|---|---|---|---|
| Australia | 1.0 | 1.0 | 1.0 | 1.0 | 1.0 |
| Australia/ACT | 1.0 | 1.0 | 1.0 | 1.0 | 0.0 |
| Australia/NSW | 0.0 | 0.0 | 0.0 | 0.0 | 1.0 |
| Australia/NT | 0.0 | 0.0 | 0.0 | 0.0 | 0.0 |
| Australia/QLD | 0.0 | 0.0 | 0.0 | 0.0 | 0.0 |
tags{'Country': array(['Australia'], dtype=object),
'Country/State': array(['Australia/ACT', 'Australia/NSW', 'Australia/NT', 'Australia/QLD',
'Australia/SA', 'Australia/TAS', 'Australia/VIC', 'Australia/WA'],
dtype=object),
'Country/Gender': array(['Australia/Female', 'Australia/Male'], dtype=object),
'Country/Legal': array(['Australia/Remanded', 'Australia/Sentenced'], dtype=object),
'Country/State/Gender/Legal': ['Australia/ACT/Female/Remanded',
'Australia/ACT/Female/Sentenced',
'Australia/ACT/Male/Remanded',
'Australia/ACT/Male/Sentenced',
'Australia/NSW/Female/Remanded',
'Australia/NSW/Female/Sentenced',
'Australia/NSW/Male/Remanded',
'Australia/NSW/Male/Sentenced',
'Australia/NT/Female/Remanded',
'Australia/NT/Female/Sentenced',
'Australia/NT/Male/Remanded',
'Australia/NT/Male/Sentenced',
'Australia/QLD/Female/Remanded',
'Australia/QLD/Female/Sentenced',
'Australia/QLD/Male/Remanded',
'Australia/QLD/Male/Sentenced',
'Australia/SA/Female/Remanded',
'Australia/SA/Female/Sentenced',
'Australia/SA/Male/Remanded',
'Australia/SA/Male/Sentenced',
'Australia/TAS/Female/Remanded',
'Australia/TAS/Female/Sentenced',
'Australia/TAS/Male/Remanded',
'Australia/TAS/Male/Sentenced',
'Australia/VIC/Female/Remanded',
'Australia/VIC/Female/Sentenced',
'Australia/VIC/Male/Remanded',
'Australia/VIC/Male/Sentenced',
'Australia/WA/Female/Remanded',
'Australia/WA/Female/Sentenced',
'Australia/WA/Male/Remanded',
'Australia/WA/Male/Sentenced']}拆分训练/测试集
我们使用最后两年(8个季度)作为测试集。
Y_test_df = Y_df.groupby('unique_id').tail(8)
Y_train_df = Y_df.drop(Y_test_df.index)
Y_test_df = Y_test_df.set_index('unique_id')
Y_train_df = Y_train_df.set_index('unique_id')2. 计算基本预测
以下单元格使用 ETS 模型计算 Y_df 中每个时间序列的 基本预测。请注意,Y_hat_df 包含预测值,但它们并不一致。
%%capture
from statsforecast.models import ETS
from statsforecast.core import StatsForecast%%capture
fcst = StatsForecast(df=Y_train_df,
models=[ETS(season_length=4, model='ZMZ')],
freq='QS', n_jobs=-1)
Y_hat_df = fcst.forecast(h=8, fitted=True)
Y_fitted_df = fcst.forecast_fitted_values()3. 调和预测
以下单元使用 HierarchicalReconciliation 类使先前的预测一致。由于层级结构并不严格
from hierarchicalforecast.methods import BottomUp, MinTrace
from hierarchicalforecast.core import HierarchicalReconciliation
reconcilers = [
BottomUp(),
MinTrace(method='mint_shrink')
]
hrec = HierarchicalReconciliation(reconcilers=reconcilers)
Y_rec_df = hrec.reconcile(Y_hat_df=Y_hat_df, Y_df=Y_fitted_df, S=S_df, tags=tags)数据框 Y_rec_df 包含已调和的预测数据。
Y_rec_df.head()| ds | ETS | ETS/BottomUp | ETS/MinTrace_method-mint_shrink | |
|---|---|---|---|---|
| unique_id | ||||
| Australia | 2015-01-01 | 34.799496 | 34.933891 | 34.927244 |
| Australia | 2015-04-01 | 35.192638 | 35.473560 | 35.440861 |
| Australia | 2015-07-01 | 35.188217 | 35.687363 | 35.476427 |
| Australia | 2015-10-01 | 35.888626 | 36.010685 | 35.946153 |
| Australia | 2016-01-01 | 36.045437 | 36.400101 | 36.244707 |
4. 评估
HierarchicalForecast 包含 HierarchicalEvaluation 类,用于评估不同的层次结构,并能够计算与基准模型相比的规模化指标。
from hierarchicalforecast.evaluation import HierarchicalEvaluationdef mase(y, y_hat, y_insample, seasonality=4):
errors = np.mean(np.abs(y - y_hat), axis=1)
scale = np.mean(np.abs(y_insample[:, seasonality:] - y_insample[:, :-seasonality]), axis=1)
return np.mean(errors / scale)
eval_tags = {}
eval_tags['Total'] = tags['Country']
eval_tags['State'] = tags['Country/State']
eval_tags['Legal status'] = tags['Country/Legal']
eval_tags['Gender'] = tags['Country/Gender']
eval_tags['Bottom'] = tags['Country/State/Gender/Legal']
eval_tags['All series'] = np.concatenate(list(tags.values()))
evaluator = HierarchicalEvaluation(evaluators=[mase])
evaluation = evaluator.evaluate(
Y_hat_df=Y_rec_df, Y_test_df=Y_test_df,
tags=eval_tags,
Y_df=Y_train_df
)
evaluation = evaluation.reset_index().drop(columns='metric').drop(0).set_index('level')
evaluation.columns = ['Base', 'BottomUp', 'MinTrace(mint_shrink)']
evaluation.applymap('{:.2f}'.format)| Base | BottomUp | MinTrace(mint_shrink) | |
|---|---|---|---|
| level | |||
| Total | 1.36 | 1.02 | 1.16 |
| State | 1.54 | 1.57 | 1.61 |
| Legal status | 2.40 | 2.50 | 2.40 |
| Gender | 1.08 | 0.81 | 0.95 |
| Bottom | 2.17 | 2.17 | 2.16 |
| All series | 2.00 | 2.00 | 2.00 |
故事比较
注意到我们可以恢复预测:原理与实践一书中报告的结果。原始结果是使用R包fable计算得出的。

参考文献
- Hyndman, R.J., & Athanasopoulos, G. (2021). “预测:原则与实践,第三版:第11章:预测分层和分组系列.”. OTexts: 墨尔本,澳大利亚。 OTexts.com/fpp3 访问于2022年7月。
- Rob Hyndman, Alan Lee, Earo Wang, Shanika Wickramasuriya, 和维护者 Earo Wang (2021). “hts: 分层和分组时间序列”. URL https://CRAN.R-project.org/package=hts. R包版本 0.3.1.
- Mitchell O’Hara-Wild, Rob Hyndman, Earo Wang, Gabriel Caceres, Tim-Gunnar Hensel, 和 Timothy Hyndman (2021). “fable: 适用于整洁时间序列的预测模型”. URL https://CRAN.R-project.org/package=fable. R包版本 6.0.2.
If you find the code useful, please ⭐ us on Github