%%capture
!pip install hierarchicalforecast
!pip install -U numba statsforecast datasetsforecast介绍
使用
HierarchialForecast进行层次预测的介绍
您可以使用CPU或GPU在Google Colab中运行这些实验。
1. 层次序列
在许多应用中,一组时间序列是分层组织的。例子包括地理层级、产品或类别的存在,这些层级定义了不同类型的聚合。
在这种情况下,预测者通常需要为所有的分解序列和聚合序列提供预测。一个自然的愿望是这些预测是“一致的”,即底层序列恰好加起来等于聚合序列的预测值。

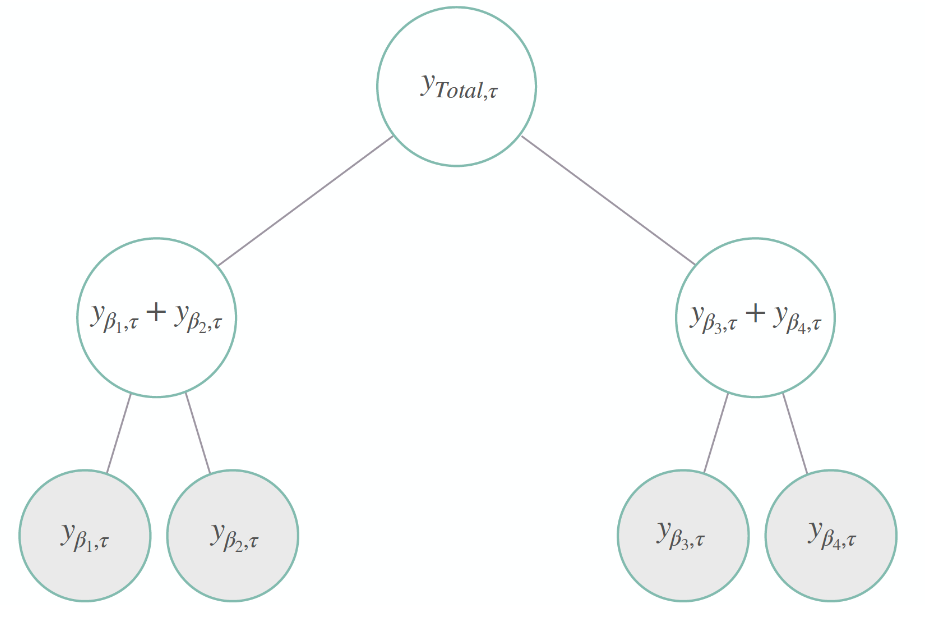
图1展示了一个简单的层次结构,其中我们有四个底层系列、两个中层系列,顶层表示总聚合。其层次聚合或一致性约束为:
\[\begin{align} y_{\mathrm{Total},\tau} = y_{\beta_{1},\tau}+y_{\beta_{2},\tau}+y_{\beta_{3},\tau}+y_{\beta_{4},\tau} \qquad \qquad \qquad \qquad \qquad \\ \mathbf{y}_{[a],\tau}=\left[y_{\mathrm{Total},\tau},\; y_{\beta_{1},\tau}+y_{\beta_{2},\tau},\;y_{\beta_{3},\tau}+y_{\beta_{4},\tau}\right]^{\intercal} \qquad \mathbf{y}_{[b],\tau}=\left[ y_{\beta_{1},\tau},\; y_{\beta_{2},\tau},\; y_{\beta_{3},\tau},\; y_{\beta_{4},\tau} \right]^{\intercal} \end{align}\]
幸运的是,这些约束可以用以下矩阵紧凑地表示:
\[\begin{align} \mathbf{S}_{[a,b][b]} = \begin{bmatrix} \mathbf{A}_{\mathrm{[a][b]}} \\ \\ \\ \mathbf{I}_{\mathrm{[b][b]}} \\ \\ \end{bmatrix} = \begin{bmatrix} 1 & 1 & 1 & 1 \\ 1 & 1 & 0 & 0 \\ 0 & 0 & 1 & 1 \\ 1 & 0 & 0 & 0 \\ 0 & 1 & 0 & 0 \\ 0 & 0 & 1 & 0 \\ 0 & 0 & 0 & 1 \\ \end{bmatrix} \end{align}\]
其中 \(\mathbf{A}_{[a,b][b]}\) 将底部系列聚合到上层,\(\mathbf{I}_{\mathrm{[b][b]}}\) 是单位矩阵。层次系列的表示为:
\[\begin{align} \mathbf{y}_{[a,b],\tau} = \mathbf{S}_{[a,b][b]} \mathbf{y}_{[b],\tau} \end{align}\]
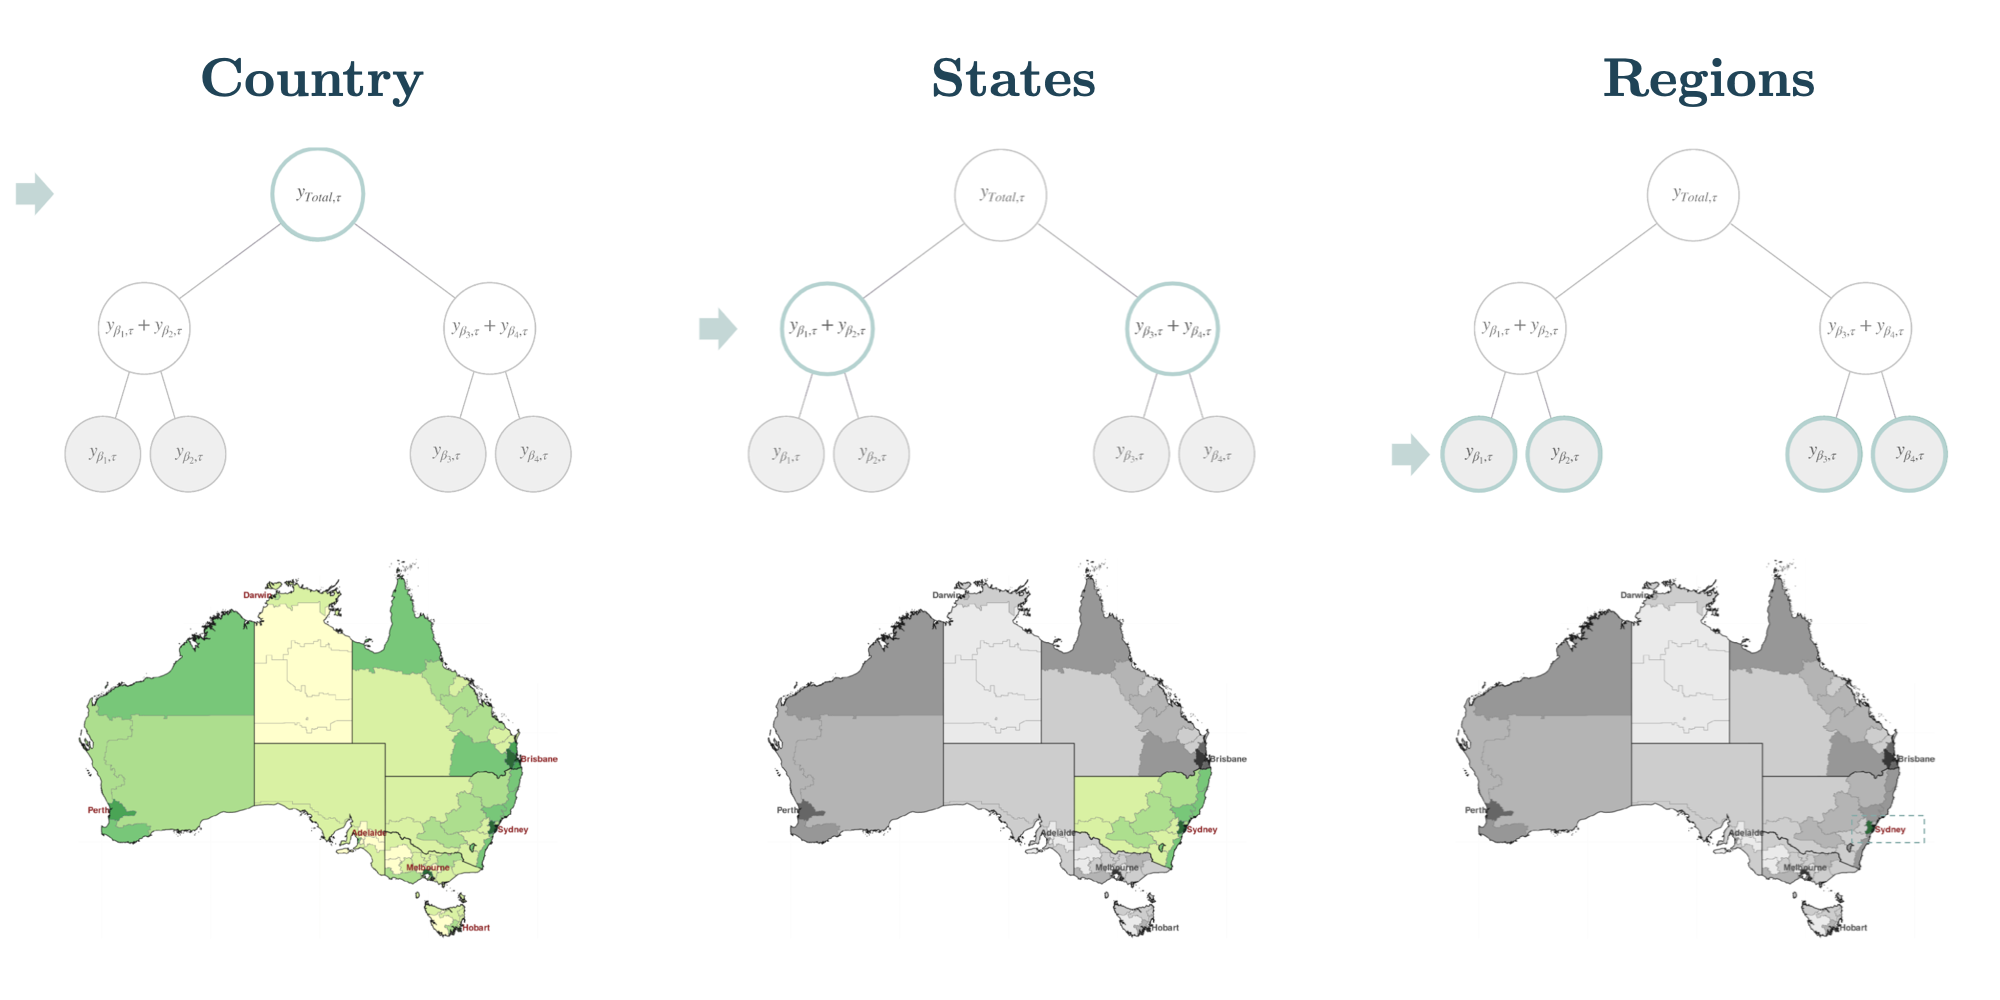
为了可视化一个例子,如图2所示。可以认为层次时间序列结构的层级代表不同的地理聚合。例如,在图2中,最顶层是一个国家内系列的总聚合,中间层是各个州,底层是各个地区。

2. 层次预测
为了实现“一致性”,大多数统计解决方案针对层次预测挑战实施了两阶段的协调过程。
1. 首先,我们获得一组基础预测 \(\mathbf{\hat{y}}_{[a,b],\tau}\)
2. 然后,我们将其协调为一致的预测 \(\mathbf{\tilde{y}}_{[a,b],\tau}\)。
大多数层次协调方法可通过以下变换来表示:
\[\begin{align} \tilde{\mathbf{y}}_{[a,b],\tau} = \mathbf{S}_{[a,b][b]} \mathbf{P}_{[b][a,b]} \hat{\mathbf{y}}_{[a,b],\tau} \end{align}\]
HierarchicalForecast库提供了一组用于该任务的Python集合,包括调和方法、数据集、评估和可视化工具。在其可用的调和方法中,我们有BottomUp、TopDown、MiddleOut、MinTrace和ERM。在其概率一致性方法中,我们有Normality、Bootstrap和PERMBU。
3. 最小示例
整理数据
import numpy as np
import pandas as pd
我们将创建一个合成数据集,以说明类似于图1所示的层次时间序列结构。
我们将创建一个具有两个层级的结构,并包含四个底层系列,其中系列的聚合是显而易见的。
# 创建图1. 合成底部数据
ds = pd.date_range(start='2000-01-01', end='2000-08-01', freq='MS')
y_base = np.arange(1,9)
r1 = y_base * (10**1)
r2 = y_base * (10**1)
r3 = y_base * (10**2)
r4 = y_base * (10**2)

ys = np.concatenate([r1, r2, r3, r4])
ds = np.tile(ds, 4)
unique_ids = ['r1'] * 8 + ['r2'] * 8 + ['r3'] * 8 + ['r4'] * 8
top_level = 'Australia'
middle_level = ['State1'] * 16 + ['State2'] * 16
bottom_level = unique_ids

bottom_df = dict(ds=ds,
                 top_level=top_level,
                 middle_level=middle_level,
                 bottom_level=bottom_level,
                 y=ys)
bottom_df = pd.DataFrame(bottom_df)
bottom_df.groupby('bottom_level').head(2)| ds | top_level | middle_level | bottom_level | y | |
|---|---|---|---|---|---|
| 0 | 2000-01-01 | Australia | State1 | r1 | 10 |
| 1 | 2000-02-01 | Australia | State1 | r1 | 20 |
| 8 | 2000-01-01 | Australia | State1 | r2 | 10 |
| 9 | 2000-02-01 | Australia | State1 | r2 | 20 |
| 16 | 2000-01-01 | Australia | State2 | r3 | 100 |
| 17 | 2000-02-01 | Australia | State2 | r3 | 200 |
| 24 | 2000-01-01 | Australia | State2 | r4 | 100 |
| 25 | 2000-02-01 | Australia | State2 | r4 | 200 |
先前介绍的层次系列 \(\mathbf{y}_{[a,b]\tau}\) 被捕获在 Y_hier_df 数据框中。
聚合约束矩阵 \(\mathbf{S}_{[a][b]}\) 被捕获在 S_df 数据框中。
最后,tags 包含一个列表,在 Y_hier_df 中组成每个层次级别,例如 tags['top_level'] 包含 Australia 的聚合系列索引。
from hierarchicalforecast.utils import aggregate# 创建层级结构和约束
hierarchy_levels = [['top_level'],
['top_level', 'middle_level'],
['top_level', 'middle_level', 'bottom_level']]
Y_hier_df, S_df, tags = aggregate(df=bottom_df, spec=hierarchy_levels)
Y_hier_df = Y_hier_df.reset_index()
print('S_df.shape', S_df.shape)
print('Y_hier_df.shape', Y_hier_df.shape)
print("tags['top_level']", tags['top_level'])S_df.shape (7, 4)
Y_hier_df.shape (56, 3)
tags['top_level'] ['Australia']/Users/cchallu/opt/anaconda3/envs/hierarchicalforecast/lib/python3.10/site-packages/sklearn/preprocessing/_encoders.py:828: FutureWarning: `sparse` was renamed to `sparse_output` in version 1.2 and will be removed in 1.4. `sparse_output` is ignored unless you leave `sparse` to its default value.
warnings.warn(Y_hier_df.groupby('unique_id').head(2)| unique_id | ds | y | |
|---|---|---|---|
| 0 | Australia | 2000-01-01 | 220.0 |
| 1 | Australia | 2000-02-01 | 440.0 |
| 8 | Australia/State1 | 2000-01-01 | 20.0 |
| 9 | Australia/State1 | 2000-02-01 | 40.0 |
| 16 | Australia/State2 | 2000-01-01 | 200.0 |
| 17 | Australia/State2 | 2000-02-01 | 400.0 |
| 24 | Australia/State1/r1 | 2000-01-01 | 10.0 |
| 25 | Australia/State1/r1 | 2000-02-01 | 20.0 |
| 32 | Australia/State1/r2 | 2000-01-01 | 10.0 |
| 33 | Australia/State1/r2 | 2000-02-01 | 20.0 |
| 40 | Australia/State2/r3 | 2000-01-01 | 100.0 |
| 41 | Australia/State2/r3 | 2000-02-01 | 200.0 |
| 48 | Australia/State2/r4 | 2000-01-01 | 100.0 |
| 49 | Australia/State2/r4 | 2000-02-01 | 200.0 |
S_df| Australia/State1/r1 | Australia/State1/r2 | Australia/State2/r3 | Australia/State2/r4 | |
|---|---|---|---|---|
| Australia | 1.0 | 1.0 | 1.0 | 1.0 |
| Australia/State1 | 1.0 | 1.0 | 0.0 | 0.0 |
| Australia/State2 | 0.0 | 0.0 | 1.0 | 1.0 |
| Australia/State1/r1 | 1.0 | 0.0 | 0.0 | 0.0 |
| Australia/State1/r2 | 0.0 | 1.0 | 0.0 | 0.0 |
| Australia/State2/r3 | 0.0 | 0.0 | 1.0 | 0.0 |
| Australia/State2/r4 | 0.0 | 0.0 | 0.0 | 1.0 |
基础预测
接下来,我们使用naive模型为每个时间序列计算基础预测。请注意,Y_hat_df包含预测值,但它们并不一致。
%%capture
from statsforecast.models import Naive
from statsforecast.core import StatsForecast
# 划分训练集/测试集
Y_test_df = Y_hier_df.groupby('unique_id').tail(4)
Y_train_df = Y_hier_df.drop(Y_test_df.index)
# 计算基准朴素预测
# 仔细识别正确的数据频率,此数据为季度数据。 'Q'
fcst = StatsForecast(df=Y_train_df,
models=[Naive()],
freq='Q', n_jobs=-1)
Y_hat_df = fcst.forecast(h=4, fitted=True)
Y_fitted_df = fcst.forecast_fitted_values()对账
from hierarchicalforecast.methods import BottomUp
from hierarchicalforecast.core import HierarchicalReconciliation
# 您可以从我们的收藏中选择一个调解者。
reconcilers = [BottomUp()] # MinTrace(method='mint_shrink')
hrec = HierarchicalReconciliation(reconcilers=reconcilers)
Y_rec_df = hrec.reconcile(Y_hat_df=Y_hat_df,
Y_df=Y_fitted_df,
S=S_df, tags=tags)
Y_rec_df.groupby('unique_id').head(2)| ds | Naive | Naive/BottomUp | |
|---|---|---|---|
| unique_id | |||
| Australia | 2000-06-30 | 880.0 | 880.0 |
| Australia | 2000-09-30 | 880.0 | 880.0 |
| Australia/State1 | 2000-06-30 | 80.0 | 80.0 |
| Australia/State1 | 2000-09-30 | 80.0 | 80.0 |
| Australia/State2 | 2000-06-30 | 800.0 | 800.0 |
| Australia/State2 | 2000-09-30 | 800.0 | 800.0 |
| Australia/State1/r1 | 2000-06-30 | 40.0 | 40.0 |
| Australia/State1/r1 | 2000-09-30 | 40.0 | 40.0 |
| Australia/State1/r2 | 2000-06-30 | 40.0 | 40.0 |
| Australia/State1/r2 | 2000-09-30 | 40.0 | 40.0 |
| Australia/State2/r3 | 2000-06-30 | 400.0 | 400.0 |
| Australia/State2/r3 | 2000-09-30 | 400.0 | 400.0 |
| Australia/State2/r4 | 2000-06-30 | 400.0 | 400.0 |
| Australia/State2/r4 | 2000-09-30 | 400.0 | 400.0 |
参考文献
- Hyndman, R.J., & Athanasopoulos, G. (2021). “预测:原理与实践,第三版: 第11章:预测分层和分组系列。” OTexts: 澳大利亚墨尔本。 OTexts.com/fpp3 访问于2022年7月。
- Orcutt, G.H., Watts, H.W., & Edwards, J.B.(1968). 数据聚合与信息损失。美国经济评论,58,773(787)。
- 为了加速产品线预测的拆分方法。预测杂志,9,233–254。 doi:10.1002/for.3980090304。
- Wickramasuriya, S. L., Athanasopoulos, G., & Hyndman, R. J. (2019). “通过迹最小化优化分层和分组时间序列的预测调和。”美国统计协会杂志, 114,804–819。 doi:10.1080/01621459.2018.1448825。
- Ben Taieb, S., & Koo, B. (2019). 不需要无偏条件的分层预测的正则化回归。在第25届ACM SIGKDD国际知识发现与数据挖掘会议KDD ’19的论文集中(第1337(1347)页)。美国纽约:计算机协会。
If you find the code useful, please ⭐ us on Github