pandas.plotting.plot_params#
- pandas.plotting.plot_params = {'xaxis.compat': False}#
存储 pandas 绘图选项。
允许参数别名,因此您可以使用与绘图函数参数相同的参数名称,但以规范格式存储,便于稍后分解为组。
参见
plotting.register_matplotlib_converters在 matplotlib 中注册 pandas 格式器和转换器。
plotting.bootstrap_plot在均值、中位数和中间范围统计上绘制Bootstrap图。
plotting.autocorrelation_plot时间序列的自相关图。
plotting.lag_plot时间序列的滞后图。
例子
>>> np.random.seed(42)
>>> df = pd.DataFrame(
...     {"A": np.random.randn(10), "B": np.random.randn(10)},
...     index=pd.date_range("1/1/2000", freq="4MS", periods=10),
... )
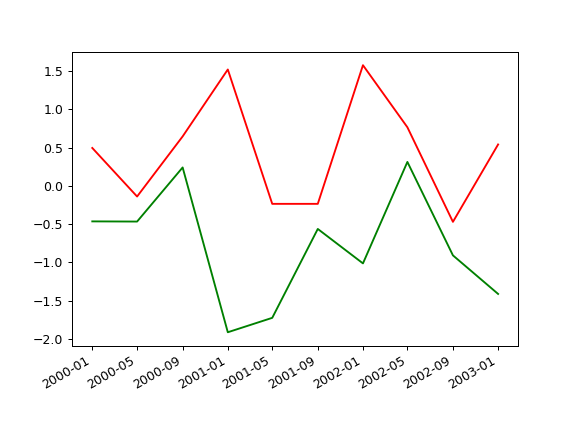
>>> with pd.plotting.plot_params.use("x_compat", True):
...     _ = df["A"].plot(color="r")
...     _ = df["B"].plot(color="g")
