pandas.plotting.table#
- pandas.plotting.table(ax, data, **kwargs)[源代码][源代码]#
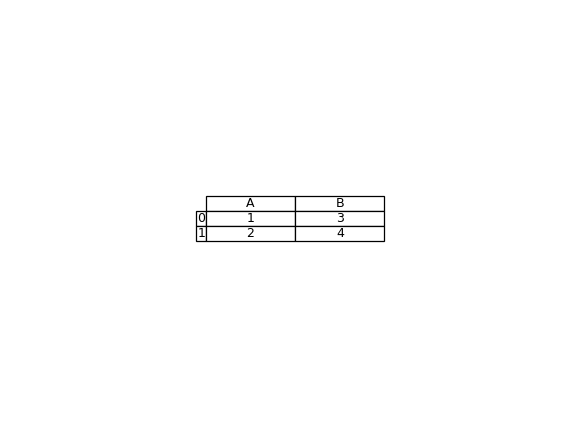
帮助函数将 DataFrame 和 Series 转换为 matplotlib.table。
- 参数:
- axMatplotlib 轴对象
要在其上绘制表格的轴。
- 数据DataFrame 或 Series
表格内容的资料。
- **kwargs
要传递给 matplotlib.table.table 的关键字参数。如果未指定 rowLabels 或 colLabels,将使用数据索引或列名。
- 返回:
- matplotlib 表格对象
创建的表格作为一个 matplotlib 表格对象。
参见
DataFrame.plot使用 matplotlib 绘制 DataFrame 的图表。
matplotlib.pyplot.table从 Matplotlib 图表中的数据创建一个表格。
示例
>>> import matplotlib.pyplot as plt
>>> df = pd.DataFrame({"A": [1, 2], "B": [3, 4]})
>>> fix, ax = plt.subplots()
>>> ax.axis("off")
(0.0, 1.0, 0.0, 1.0)
>>> table = pd.plotting.table(
...     ax, df, loc="center", cellLoc="center", colWidths=list([0.2, 0.2])
... )
