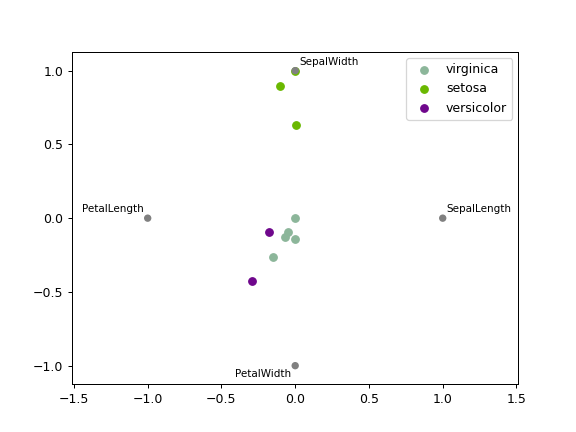
pandas.plotting.radviz#
- pandas.plotting.radviz(frame, class_column, ax=None, color=None, colormap=None, **kwds)[源代码][源代码]#
在2D中绘制多维数据集。
DataFrame 中的每个 Series 在一个圆上均匀分布。每个数据点根据每个 Series 的值在圆上呈现。在 DataFrame 中高度相关的 Series 在单位圆上更靠近。
RadViz 允许将一个 N 维数据集投影到 2D 空间中,其中每个维度的影响可以解释为所有维度影响的平衡。
更多信息可在描述 RadViz 的 原始文章 中找到。
- 参数:
- frameDataFrame
对象持有数据。
- class_columnstr
包含数据点类别名称的列名。
- ax :
matplotlib.axes.Axes, 可选matplotlib.axes.Axes, 可选 一个要添加信息的绘图实例。
- 颜色list[str] 或 tuple[str], 可选
为每个类别分配一种颜色。示例:[‘蓝色’, ‘绿色’]。
- colormap : str 或
matplotlib.colors.Colormap,默认 Nonestr 或 用于选择颜色的颜色映射。如果是字符串,则从 matplotlib 加载具有该名称的颜色映射。
- **kwds
传递给 matplotlib 散点绘图方法的选项。
- 返回:
matplotlib.axes.Axes来自 Matplotlib 的 Axes 对象。
参见
plotting.andrews_curves绘制聚类可视化。
例子
>>> df = pd.DataFrame(
...     {
...         "SepalLength": [6.5, 7.7, 5.1, 5.8, 7.6, 5.0, 5.4, 4.6, 6.7, 4.6],
...         "SepalWidth": [3.0, 3.8, 3.8, 2.7, 3.0, 2.3, 3.0, 3.2, 3.3, 3.6],
...         "PetalLength": [5.5, 6.7, 1.9, 5.1, 6.6, 3.3, 4.5, 1.4, 5.7, 1.0],
...         "PetalWidth": [1.8, 2.2, 0.4, 1.9, 2.1, 1.0, 1.5, 0.2, 2.1, 0.2],
...         "Category": [
...             "virginica",
...             "virginica",
...             "setosa",
...             "virginica",
...             "virginica",
...             "versicolor",
...             "versicolor",
...             "setosa",
...             "virginica",
...             "setosa",
...         ],
...     }
... )
>>> pd.plotting.radviz(df, "Category")
