连贯性#
- scipy.signal.coherence(x, y, fs=1.0, window='hann', nperseg=None, noverlap=None, nfft=None, detrend='constant', axis=-1)[源代码][源代码]#
使用 Welch 方法估计离散时间信号 X 和 Y 的幅值平方相干估计 Cxy。
Cxy = abs(Pxy)**2/(Pxx*Pyy),其中 Pxx 和 Pyy 是 X 和 Y 的功率谱密度估计,Pxy 是 X 和 Y 的互谱密度估计。- 参数:
- xarray_like
测量值的时间序列
- yarray_like
测量值的时间序列
- fsfloat, 可选
x 和 y 时间序列的采样频率。默认为 1.0。
- 窗口str 或 tuple 或 array_like,可选
要使用的期望窗口。如果 window 是一个字符串或元组,它会被传递给
get_window以生成窗口值,这些值默认是 DFT-even 的。请参阅get_window以获取窗口列表和所需参数。如果 window 是类数组,它将直接用作窗口,其长度必须为 nperseg。默认为汉宁窗口。- npersegint, 可选
每个片段的长度。默认为 None,但如果 window 是 str 或 tuple,则设置为 256,如果 window 是 array_like,则设置为 window 的长度。
- noverlap: int, 可选
段落之间重叠的点数。如果为 None,则
noverlap = nperseg // 2。默认为 None。- nfftint, 可选
使用的FFT长度,如果需要零填充FFT。如果为 None,则FFT长度为 nperseg。默认为 None。
- detrend : str 或 function 或 False, 可选字符串或函数或
指定如何去趋势化每个片段。如果
detrend是一个字符串,它将作为 type 参数传递给detrend函数。如果它是一个函数,它接受一个片段并返回一个去趋势化的片段。如果detrend是 False,则不进行去趋势化。默认为 ‘constant’。- 轴int, 可选
计算两个输入的相关性时沿用的轴;默认是沿最后一个轴(即
axis=-1)。
- 返回:
- fndarray
样本频率数组。
- Cxyndarray
x 和 y 的幅度平方相干性。
参见
periodogram简单的,可选择修改的周期图
lombscargle不均匀采样数据的Lomb-Scargle周期图
welch通过 Welch 方法的功率谱密度。
csd通过 Welch 方法计算的交叉谱密度。
注释
适当的重叠量将取决于窗口的选择和您的需求。对于默认的Hann窗口,50%的重叠是一个合理的折中,既能准确估计信号功率,又不会过度计算任何数据。较窄的窗口可能需要更大的重叠。
Added in version 0.16.0.
参考文献
[1]P. Welch, “The use of the fast Fourier transform for the estimation of power spectra: A method based on time averaging over short, modified periodograms”, IEEE Trans. Audio Electroacoust. vol. 15, pp. 70-73, 1967.
[2]Stoica, Petre, 和 Randolph Moses, “信号的频谱分析” Prentice Hall, 2005
示例
>>> import numpy as np
>>> from scipy import signal
>>> import matplotlib.pyplot as plt
>>> rng = np.random.default_rng()
生成两个具有一些共同特征的测试信号。
>>> fs = 10e3
>>> N = 1e5
>>> amp = 20
>>> freq = 1234.0
>>> noise_power = 0.001 * fs / 2
>>> time = np.arange(N) / fs
>>> b, a = signal.butter(2, 0.25, 'low')
>>> x = rng.normal(scale=np.sqrt(noise_power), size=time.shape)
>>> y = signal.lfilter(b, a, x)
>>> x += amp*np.sin(2*np.pi*freq*time)
>>> y += rng.normal(scale=0.1*np.sqrt(noise_power), size=time.shape)
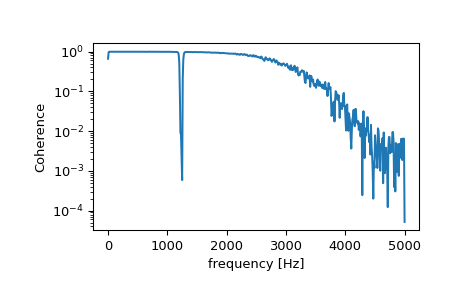
计算并绘制相干性。
>>> f, Cxy = signal.coherence(x, y, fs, nperseg=1024)
>>> plt.semilogy(f, Cxy)
>>> plt.xlabel('frequency [Hz]')
>>> plt.ylabel('Coherence')
>>> plt.show()
