层次化协调 - 澳大利亚旅游数据集上的示例
在这个笔记本中,我们演示了分层调和。我们将使用澳大利亚旅游数据集(最初来自 这里),该数据集包含按地区、旅行原因和城市/非城市旅游类型细分的每月旅游人数。
我们将使用Rob Hyndman的书 这里 中介绍的技术,并且我们将看到使用Darts可以在几行代码中实现预测的协调。
首先,导入一些内容:
[1]:
# fix python path if working locally
from utils import fix_pythonpath_if_working_locally

fix_pythonpath_if_working_locally()
%matplotlib inline
[2]:
import matplotlib.pyplot as plt
import numpy as np
from itertools import product
from pprint import pprint

from darts import concatenate, TimeSeries
from darts.dataprocessing.transformers import MinTReconciliator
from darts.datasets import AustralianTourismDataset
from darts.metrics import mae
from darts.models import LinearRegressionModel, Theta
/Users/dennisbader/miniconda3/envs/darts310_test/lib/python3.10/site-packages/statsforecast/utils.py:237: FutureWarning: 'M' is deprecated and will be removed in a future version, please use 'ME' instead.
  "ds": pd.date_range(start="1949-01-01", periods=len(AirPassengers), freq="M"),
加载数据
下面,我们加载一个多变量的 TimeSeries``(即,包含多个分量)。为了简单起见,我们仅使用 ``AustralianTourismDataset Darts 数据集,但我们也可以使用 TimeSeries.from_dataframe(df),提供一个包含每分量一列和每时间戳一行的 DataFrame df。
[3]:
tourism_series = AustralianTourismDataset().load()
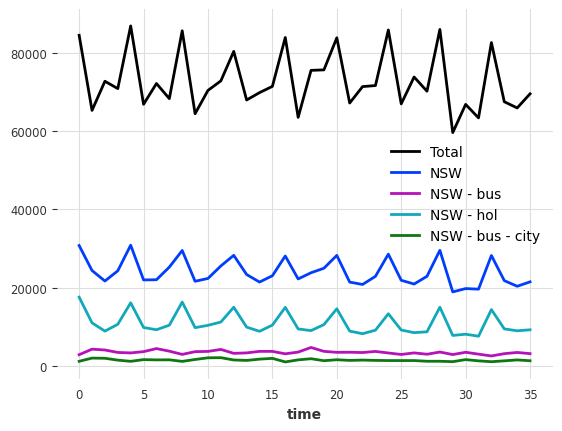
本系列包含几个组件:
一个名为
"Total"的组件,每个旅游原因一个组件(
"Hol"表示假期,"Bus"表示商务等)每个 (地区, 原因) 对一个组件(命名为
"NSW - hol","NSW - bus"等)每个 (地区, 原因, <城市>) 元组对应一个组件,其中 <城市> 要么是
"city"要么是"noncity"。因此这些组件被命名为"NSW - hol - city"、"NSW - hol - noncity"、"NSW - bus - city"等。
让我们绘制其中的一些:
[4]:
tourism_series[["Total", "NSW", "NSW - bus", "NSW - hol", "NSW - bus - city"]].plot()
[4]:
<Axes: xlabel='time'>
检查层次结构
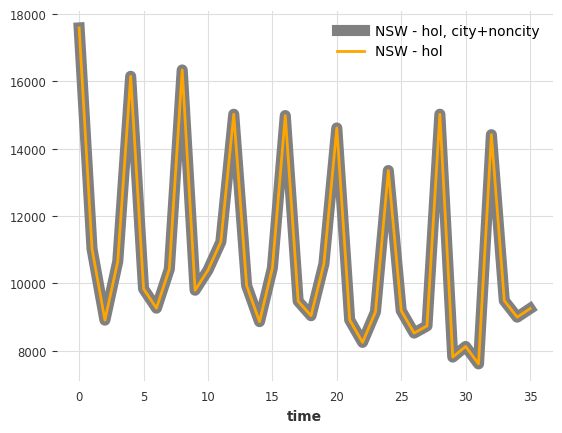
这些组成部分中的一些在某些方式上相加。例如,新南威尔士州的假日旅游总额可以分解为“城市”和“非城市”假日新南威尔士州旅游的总和:
[5]:
sum_city_noncity = (
    tourism_series["NSW - hol - city"] + tourism_series["NSW - hol - noncity"]
)
sum_city_noncity.plot(label="NSW - hol, city+noncity", lw=8, color="grey")
tourism_series["NSW - hol"].plot(color="orange")
[5]:
<Axes: xlabel='time'>
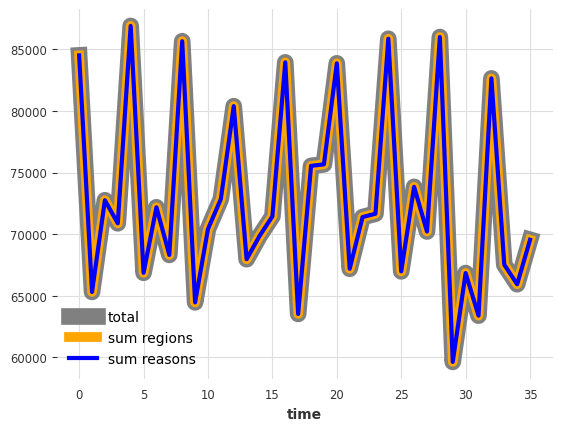
同样地,区域总和与原因总和都加起来等于总数:
[6]:
reasons = ["Hol", "VFR", "Bus", "Oth"]
regions = ["NSW", "VIC", "QLD", "SA", "WA", "TAS", "NT"]
city_labels = ["city", "noncity"]

tourism_series["Total"].plot(label="total", lw=12, color="grey")
tourism_series[regions].sum(axis=1).plot(label="sum regions", lw=7, color="orange")
tourism_series[reasons].sum(axis=1).plot(label="sum reasons", lw=3, color="blue")
[6]:
<Axes: xlabel='time'>
总的来说,我们的层次结构如下所示:
编码层次结构
我们现在将以Darts理解的方式编码层次结构本身。这很简单:层次结构简单地表示为一个 dict ,其中键是组件名称,值是包含该组件在层次结构中的父组件的列表。
例如,参考上图:
"Hol"映射到["Total"],因为它是左侧树中"Total"的子节点。"NSW - hol"被映射到["Hol", "NSW"],因为它同时是 ``”Hol”``(在左树中)和 ``”NSW”``(在右树中)的子节点。"NSW - bus - city"被映射到["NSW - bus"],因为它是右树中"NSW - bus"的子节点。等等…
因此,除了 "Total" 之外的所有组件都将作为层次结构字典中的一个键出现。由于我们有相当多的组件(96个),我们将不会手动构建这个字典,而是通过编程方式来实现:
[7]:
hierarchy = dict()

# Fill in grouping by reason
for reason in reasons:
    hierarchy[reason] = ["Total"]

# Fill in grouping by region
for region in regions:
    hierarchy[region] = ["Total"]

# Fill in grouping by (region, reason)
for region, reason in product(regions, reasons):
    hierarchy["{} - {}".format(region, reason.lower())] = [reason, region]

# Fill in grouping by (region, reason, <city>)
for region, reason, city in product(regions, reasons, city_labels):
    hierarchy["{} - {} - {}".format(region, reason.lower(), city)] = [
        "{} - {}".format(region, reason.lower())
    ]
作为健全性检查,让我们看看层次结构中几个组件的映射:
[8]:
for component in ["Hol", "NSW - hol", "NSW - bus - city"]:
    print(f"{component} -> {hierarchy[component]}")
Hol -> ['Total']
NSW - hol -> ['Hol', 'NSW']
NSW - bus - city -> ['NSW - bus']
很好,看起来符合预期。
在 Darts 中,层次结构是 TimeSeries 对象的一个属性。我们现在可以将层次结构嵌入到我们的 TimeSeries 中。我们使用 with_hierarchy() 方法来实现这一点,但我们也可以在序列构造时指定层次结构;例如,向 TimeSeries.from_dataframe() 工厂方法提供一个 hierarchy。
[9]:
tourism_series = tourism_series.with_hierarchy(hierarchy)
使用多元模型进行预测
现在我们有一个包含层次信息的多变量时间序列。让我们将其拆分为训练/评估部分。我们将保留最后12个月作为验证集。
[10]:
train, val = tourism_series[:-12], tourism_series[-12:]
获取预测现在就像使用Darts支持多元序列的模型一样简单:
[11]:
model = LinearRegressionModel(lags=12)
model.fit(train)
pred = model.predict(n=len(val))
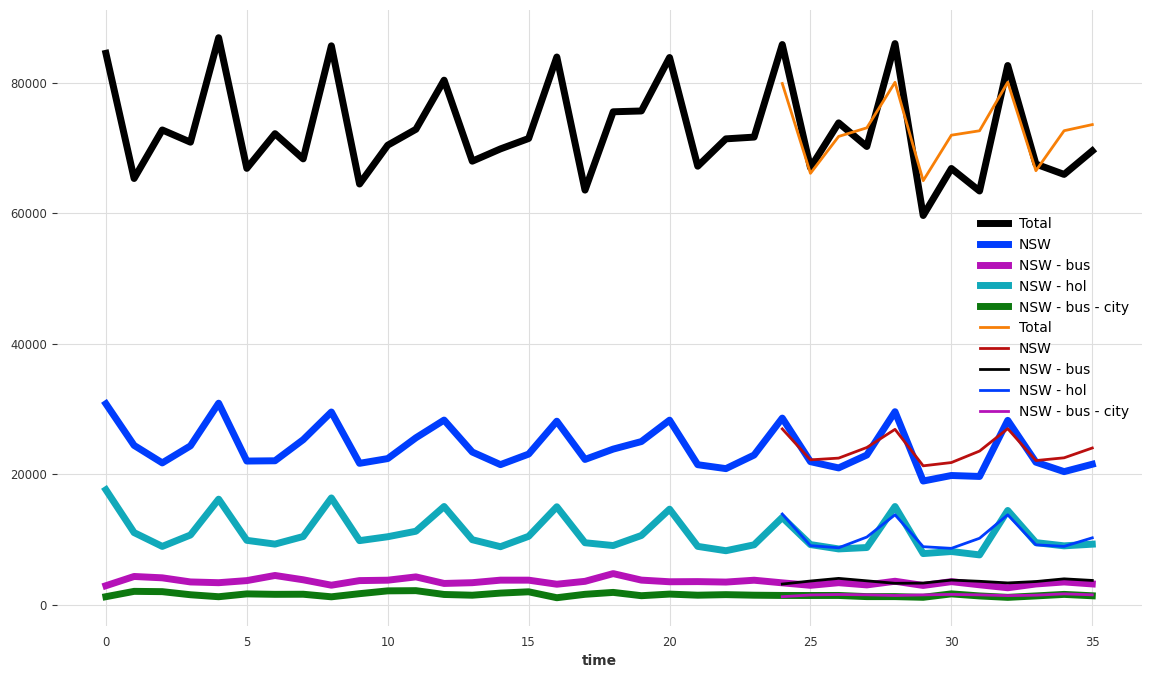
让我们看看我们的预测:
[12]:
components_to_show = ["Total", "NSW", "NSW - bus", "NSW - hol", "NSW - bus - city"]
plt.figure(figsize=(14, 8))
tourism_series[components_to_show].plot(lw=5)
pred[components_to_show].plot(lw=2)
[12]:
<Axes: xlabel='time'>
让我们也计算不同层次的准确性(MAE,在多个组件上平均):
[13]:
# we pre-generate some of the components' names
regions_reasons_comps = list(
    map(lambda t: "{} - {}".format(t[0], t[1].lower()), product(regions, reasons))
)

regions_reasons_city_comps = list(
    map(
        lambda t: "{} - {} - {}".format(t[0], t[1].lower(), t[2]),
        product(regions, reasons, city_labels),
    )
)


def measure_mae(pred):
    def print_mae_on_subset(subset, name):
        print(
            "mean MAE on {}: {:.2f}".format(
                name,
                mae(pred[subset], val[subset]),
            )
        )

    print_mae_on_subset(["Total"], "total")
    print_mae_on_subset(reasons, "reasons")
    print_mae_on_subset(regions, "regions")
    print_mae_on_subset(regions_reasons_comps, "(region, reason)")
    print_mae_on_subset(regions_reasons_city_comps, "(region, reason, city)")


measure_mae(pred)
mean MAE on total: 4311.00
mean MAE on reasons: 1299.87
mean MAE on regions: 815.08
mean MAE on (region, reason): 315.89
mean MAE on (region, reason, city): 191.85
调和预测
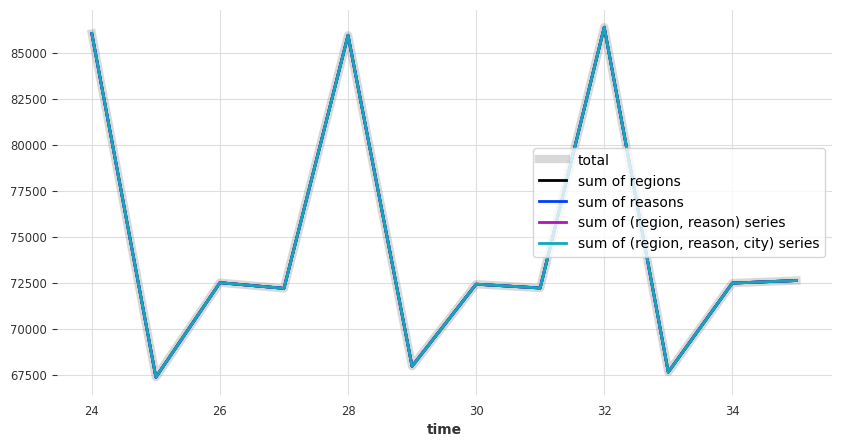
首先,让我们看看我们当前的“原始”预测是否加总:
[14]:
def plot_forecast_sums(pred_series):
    plt.figure(figsize=(10, 5))

    pred_series["Total"].plot(label="total", lw=6, alpha=0.3, color="grey")
    pred_series[regions].sum(axis=1).plot(label="sum of regions")
    pred_series[reasons].sum(axis=1).plot(label="sum of reasons")
    pred_series[regions_reasons_comps].sum(axis=1).plot(
        label="sum of (region, reason) series"
    )
    pred_series[regions_reasons_city_comps].sum(axis=1).plot(
        label="sum of (region, reason, city) series"
    )

    legend = plt.legend(loc="best", frameon=1)
    frame = legend.get_frame()
    frame.set_facecolor("white")


plot_forecast_sums(pred)
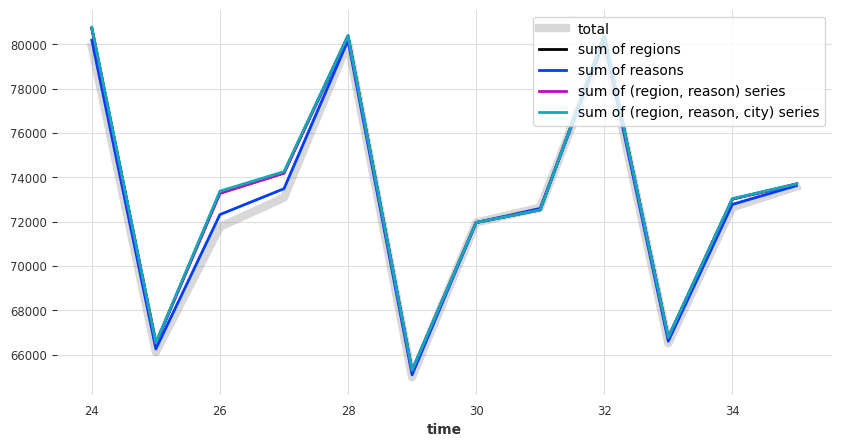
看来他们没有。所以让我们来调和它们。我们将使用 darts.dataprocessing.transformers 中的一些转换器来实现这一点。这些转换器可以执行 事后 调和(即,在获得预测后进行调和)。我们手头有以下方法:
BottomUpReconciliator执行自底向上的协调,简单地将层次结构中的每个组件重置为其子组件的总和(API 文档)。TopDownReconciliator执行自上而下的协调,它使用历史比例将聚合预测分解到层次结构中。此转换器需要使用历史值(即训练序列)调用fit()以学习这些比例(API 文档)。MinTReconciliator是一种执行“最优”调和的技术,详细内容请参见 这里。这个转换器可以通过 API 文档 中列出的几种不同方式工作。
下面,我们使用 MinTReconciliator 的 wls_val 变体:
[15]:
reconciliator = MinTReconciliator(method="wls_val")
reconciliator.fit(train)
reconcilied_preds = reconciliator.transform(pred)
现在让我们检查一下,调和后的预测是否如我们所预期的那样加总:
[16]:
plot_forecast_sums(reconcilied_preds)
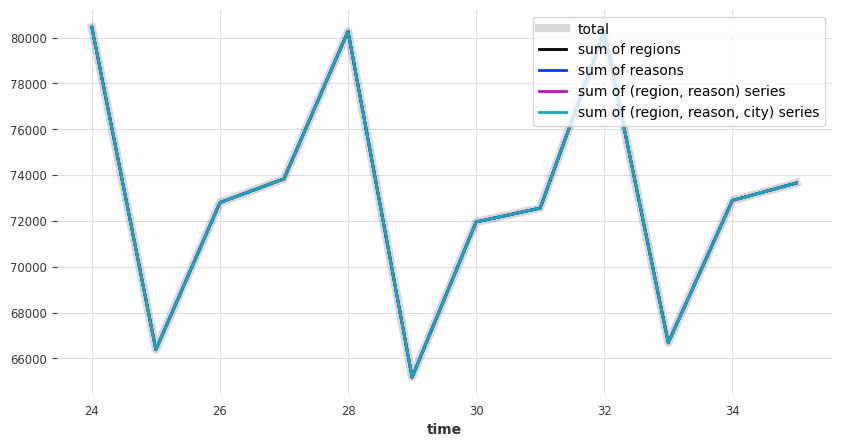
看起来不错 - 那么MAE误差如何:
[17]:
measure_mae(reconcilied_preds)
mean MAE on total: 4205.92
mean MAE on reasons: 1294.87
mean MAE on regions: 810.68
mean MAE on (region, reason): 315.11
mean MAE on (region, reason, city): 191.36
与之前相比,MAE 略有增加(例如,在总体水平上),而在某些更细粒度的水平上则略有下降。这是对账的典型特征:它可能会增加误差,但在某些情况下也会减少误差。
替代方案:独立预测组件
上面,我们简单地在我们的多变量序列上拟合了一个单一的多变量模型。这意味着每个维度的预测都消耗了所有其他维度的(滞后)值。下面,为了举例说明,我们重复了这个实验,但使用了“局部”模型来独立地预测每个分量。我们使用了一个简单的 Theta 模型,并将所有预测连接成一个单一的多变量 TimeSeries:
[18]:
preds = []
for component in tourism_series.components:
    model = Theta()
    model.fit(train[component])
    preds.append(model.predict(n=len(val)))

pred = concatenate(preds, axis="component")
/Users/dennisbader/miniconda3/envs/darts310_test/lib/python3.10/site-packages/statsmodels/tsa/holtwinters/model.py:917: ConvergenceWarning: Optimization failed to converge. Check mle_retvals.
  warnings.warn(
让我们绘制一些预测,并显示MAE误差:
[19]:
plt.figure(figsize=(14, 8))
tourism_series[components_to_show].plot(lw=5)
pred[components_to_show].plot(lw=2)
measure_mae(pred)
mean MAE on total: 3294.38
mean MAE on reasons: 1204.76
mean MAE on regions: 819.13
mean MAE on (region, reason): 329.39
mean MAE on (region, reason, city): 195.16
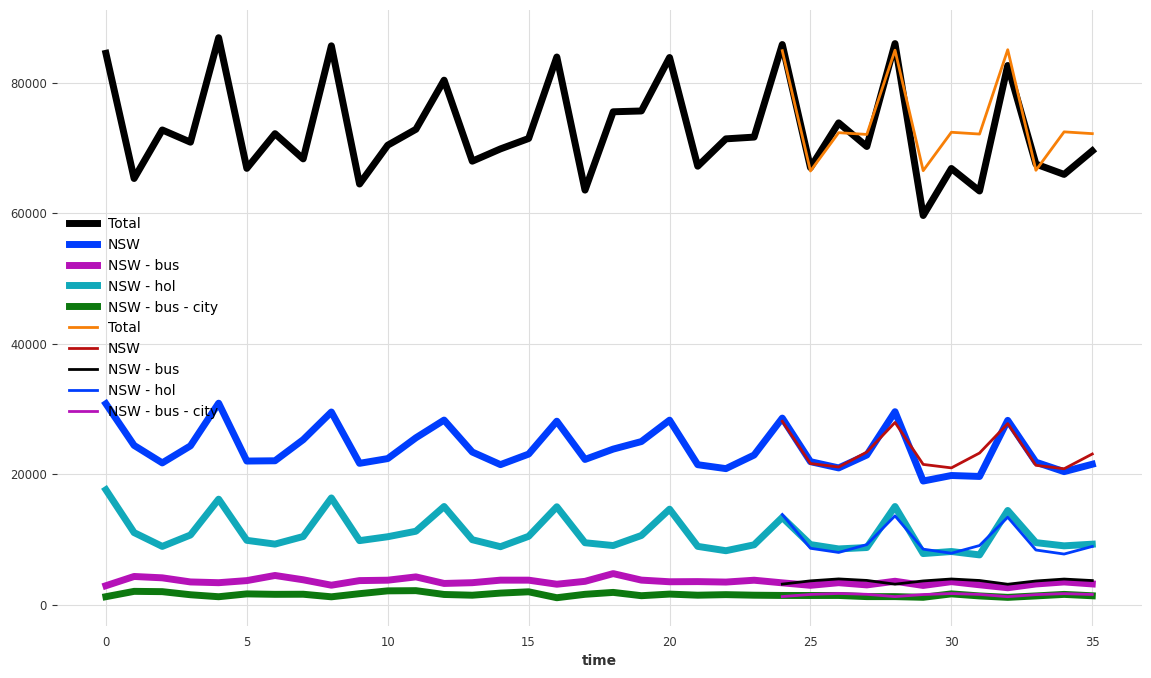
正如预期的那样,这些预测也没有加起来:
[20]:
plot_forecast_sums(pred)
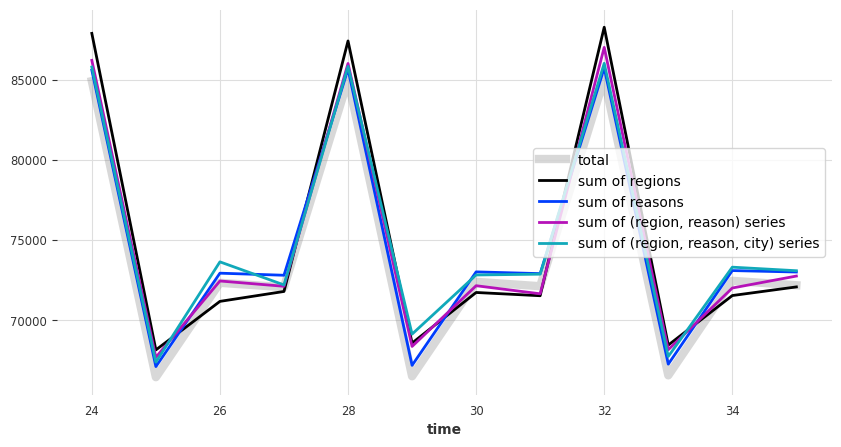
让我们使用 MinTReconciliator 来将它们相加:
[21]:
reconciliator = MinTReconciliator(method="wls_val")
reconciliator.fit(train)
reconcilied_preds = reconciliator.transform(pred)

plot_forecast_sums(reconcilied_preds)
measure_mae(reconcilied_preds)
mean MAE on total: 3349.33
mean MAE on reasons: 1215.91
mean MAE on regions: 782.26
mean MAE on (region, reason): 316.39
mean MAE on (region, reason, city): 199.92
