CyclicalFeatures#
一些特征本质上是有周期性的。明显的例子是 时间特征,即那些从日期时间变量派生的特征,如 一天中的小时、一周中的天数 或 一年中的月份。
但这并不是全部。许多与自然过程相关的变量也是周期性的,例如,潮汐、*月周期*或*太阳能发电*(这与光周期一致,光周期也是周期性的)。
在循环特征中,变量的较高值更接近较低值。例如,十二月(12)比六月(6)更接近一月(1)。
我们如何向线性回归等机器学习模型传达特征的周期性?
在文章《用于建筑性能模拟的高级机器学习技术》中,作者们通过将周期性变量表示为圆上的(x,y)坐标来对其进行工程处理。其想法是,在预处理周期性数据后,每个周期性特征的最小值将紧邻最大值出现。
为了在 (x, y) 坐标中表示周期性特征,作者创建了两个新特征,导出周期性变量的正弦和余弦分量。我们将此过程称为 “周期性编码”。
循环编码#
三角函数正弦和余弦是周期性的,每2π弧度重复其值。因此,要使用这些函数将循环变量转换为(x, y)坐标,首先我们需要将它们归一化为2π弧度。
我们通过将变量的值除以它们的最大值来实现这一点。因此,这两个新特征推导如下:
var_sin = sin(variable * (2. * pi / max_value))
var_cos = cos(variable * (2. * pi / max_value))
在Python中,我们可以使用Numpy函数 sin 和 cos 来编码周期性特征:
import numpy as np

X[f"{variable}_sin"] = np.sin(X["variable"] * (2.0 * np.pi / X["variable"]).max())
X[f"{variable}_cos"] = np.cos(X["variable"] * (2.0 * np.pi / X["variable"]).max())
我们也可以使用 Feature-engine 来自动化这个过程。
使用 Feature-engine 进行循环编码#
CyclicalFeatures() 从数值变量中创建两个新特征,以更好地捕捉原始变量的周期性。CyclicalFeatures() 根据以下规则为每个变量返回两个新特征:
var_sin = sin(variable * (2. * pi / max_value))
var_cos = cos(variable * (2. * pi / max_value))
其中 max_value 是变量中的最大值,而 pi 是 3.14…
找到最大值#
CyclicalFeatures() 试图通过自动确定用于将特征归一化到 0 到 2 * pi 弧度之间的值来实现循环编码的自动化,这与周期函数正弦和余弦的周期相吻合。
因此,变量的值很重要。例如,如果变量 hour 显示的值在 0 到 23 之间,它将通过除以 23 来创建新特征。如果变量的值在 1 到 24 之间变化,它将通过除以 24 来创建新特征。
如果你想使用特定的时间段来重新缩放你的变量,你可以传递一个字典,其中包含变量名作为键,缩放值作为值。通过这种方式,你可以对一个显示0到23之间值的变量应用循环编码,同时除以24。
应用循环编码#
我们将首先对一个玩具数据集应用循环编码,以熟悉如何使用 Feature-engine 进行循环编码。
在这个例子中,我们将对周期性特征 星期几 和 月份 进行编码。让我们创建一个包含“days”和“months”变量的玩具数据框:
import pandas as pd
from feature_engine.creation import CyclicalFeatures

df = pd.DataFrame({
    'day': [6, 7, 5, 3, 1, 2, 4],
    'months': [3, 7, 9, 12, 4, 6, 12],
    })
在以下输出中,我们看到了玩具数据框:
   day  months
0    6       3
1    7       7
2    5       9
3    3      12
4    1       4
5    2       6
6    4      12
现在我们设置 CyclicalFeatures() 来自动查找每个变量的最大值:
cyclical = CyclicalFeatures(variables=None, drop_original=False)

X = cyclical.fit_transform(df)
用于转换的最大值存储在属性 max_values_ 中。
cyclical.max_values_
{'day': 7, 'months': 12}
让我们看一下转换后的数据框:
print(X.head())
我们看到新变量被添加到数据框的右侧。
   day  months       day_sin   day_cos    months_sin    months_cos
0    6       3 -7.818315e-01  0.623490  1.000000e+00  6.123234e-17
1    7       7 -2.449294e-16  1.000000 -5.000000e-01 -8.660254e-01
2    5       9 -9.749279e-01 -0.222521 -1.000000e+00 -1.836970e-16
3    3      12  4.338837e-01 -0.900969 -2.449294e-16  1.000000e+00
4    1       4  7.818315e-01  0.623490  8.660254e-01 -5.000000e-01
编码后删除变量#
在上一节中,我们将参数 drop_original 设置为 False,这意味着在循环编码后我们保留原始变量。如果我们希望在特征创建后删除它们,可以将参数设置为 True:
cyclical = CyclicalFeatures(variables=None, drop_original=True)
X = cyclical.fit_transform(df)
print(X.head())
生成的数据框仅包含循环编码的特征;原始变量已被移除:
        day_sin   day_cos    months_sin    months_cos
0 -7.818315e-01  0.623490  1.000000e+00  6.123234e-17
1 -2.449294e-16  1.000000 -5.000000e-01 -8.660254e-01
2 -9.749279e-01 -0.222521 -1.000000e+00 -1.836970e-16
3  4.338837e-01 -0.900969 -2.449294e-16  1.000000e+00
4  7.818315e-01  0.623490  8.660254e-01 -5.000000e-01
我们现在可以使用这些新特性,它们传达了数据的周期性,来训练机器学习算法,如线性或逻辑回归。
获取生成的特征名称#
我们可以按如下方式获取转换后的数据集中变量的名称:
cyclical.get_feature_names_out()
这将返回最终输出中所有变量的名称:
['day_sin', 'day_cos', 'months_sin', 'months_cos']
理解循环编码#
我们现在知道如何通过使用正弦和余弦函数将循环变量转换为圆的 (x, y) 坐标。现在让我们进行一些可视化,以更好地理解这种转换的效果。
让我们创建一个玩具数据框:
import pandas as pd
import matplotlib.pyplot as plt

df = pd.DataFrame([i for i in range(24)], columns=['hour'])
如果我们执行 print(df),我们将看到结果数据框:
    hour
0      0
1      1
2      2
3      3
4      4
5      5
6      6
7      7
8      8
9      9
10    10
11    11
12    12
13    13
14    14
15    15
16    16
17    17
18    18
19    19
20    20
21    21
22    22
23    23
现在让我们计算正弦和余弦特征,然后显示结果数据框:
cyclical = CyclicalFeatures(variables=None)

df = cyclical.fit_transform(df)

print(df.head())
这些是表示小时的正弦和余弦特征:
   hour  hour_sin  hour_cos
0     0  0.000000  1.000000
1     1  0.269797  0.962917
2     2  0.519584  0.854419
3     3  0.730836  0.682553
4     4  0.887885  0.460065
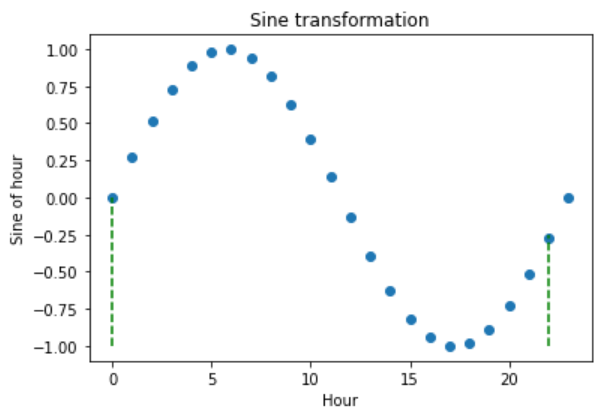
现在让我们绘制小时变量与其正弦变换的关系图。我们添加垂直线来标记小时0和22。
plt.scatter(df["hour"], df["hour_sin"])

# Axis labels
plt.ylabel('Sine of hour')
plt.xlabel('Hour')
plt.title('Sine transformation')

plt.vlines(x=0, ymin=-1, ymax=0, color='g', linestyles='dashed')
plt.vlines(x=22, ymin=-1, ymax=-0.25, color='g', linestyles='dashed')
在使用正弦函数进行变换后,我们看到小时0和22的新值彼此更接近(跟随虚线),这正是我们所期望的:

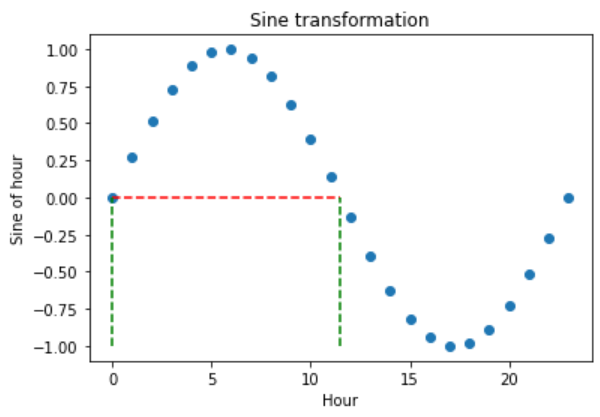
三角变换的问题在于,由于它们是周期性的,两个不同的观测值在变换后也可能返回相似的值。让我们来探讨一下:
plt.scatter(df["hour"], df["hour_sin"])

# Axis labels
plt.ylabel('Sine of hour')
plt.xlabel('Hour')
plt.title('Sine transformation')

plt.hlines(y=0, xmin=0, xmax=11.5, color='r', linestyles='dashed')

plt.vlines(x=0, ymin=-1, ymax=0, color='g', linestyles='dashed')
plt.vlines(x=11.5, ymin=-1, ymax=0, color='g', linestyles='dashed')
在下图中,我们看到在正弦变换后,0小时和11.5小时获得了非常相似的值,但它们彼此并不接近。那么我们如何区分它们呢?

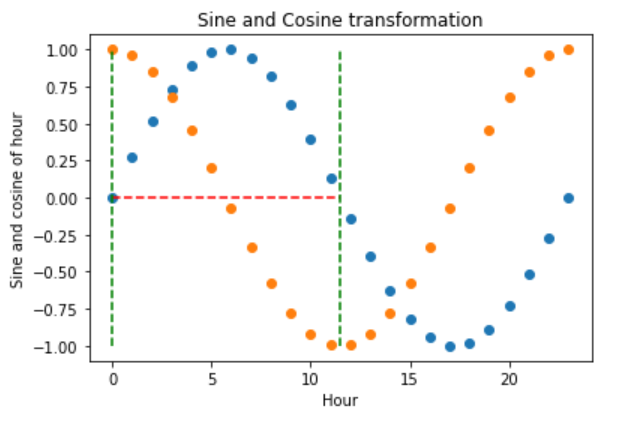
要完全编码小时的信息,我们必须同时使用正弦和余弦三角变换。添加相对于正弦函数相位偏移的余弦函数,打破了对称性,并为每个小时分配了唯一的编码。
让我们来探讨一下:
plt.scatter(df["hour"], df["hour_sin"])
plt.scatter(df["hour"], df["hour_cos"])

# Axis labels
plt.ylabel('Sine and cosine of hour')
plt.xlabel('Hour')
plt.title('Sine and Cosine transformation')


plt.hlines(y=0, xmin=0, xmax=11.5, color='r', linestyles='dashed')

plt.vlines(x=0, ymin=-1, ymax=1, color='g', linestyles='dashed')
plt.vlines(x=11.5, ymin=-1, ymax=1, color='g', linestyles='dashed')
在转换后的小时0,正弦值为0,余弦值为1,这与小时11.5不同,后者正弦值为0,余弦值为-1。换句话说,通过这两个函数,我们能够区分原始变量中的所有观测值。

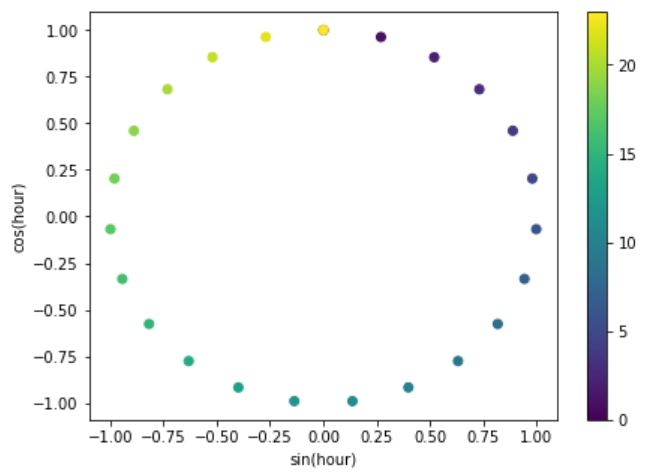
最后,让我们可视化由正弦和余弦特征生成的 (x, y) 圆坐标。
fig, ax = plt.subplots(figsize=(7, 5))
sp = ax.scatter(df["hour_sin"], df["hour_cos"], c=df["hour"])
ax.set(
    xlabel="sin(hour)",
    ylabel="cos(hour)",
)
_ = fig.colorbar(sp)
以下图表传达了将循环编码应用于周期性特征所产生的预期效果。

就是这样,你现在知道如何通过使用三角函数和循环编码来表示循环数据了。
Feature-engine vs Scikit-learn#
让我们比较一下 Feature-engine 和 Scikit-learn 在循环编码实现上的差异。我们将使用 Bike sharing demand 数据集,并遵循 Scikit-learn 的 时间相关特征文档 中的循环编码实现。
让我们加载库和数据集:
import numpy as np
import pandas as pd

from sklearn.compose import ColumnTransformer
from sklearn.datasets import fetch_openml
from sklearn.preprocessing import FunctionTransformer

from feature_engine.creation import CyclicalFeatures

df = fetch_openml("Bike_Sharing_Demand", version=2, as_frame=True).frame

print(df.head())
在以下输出中,我们看到了共享单车数据集:
   season  year  month  hour holiday  weekday workingday weather  temp  \
0  spring     0      1     0   False        6      False   clear  9.84
1  spring     0      1     1   False        6      False   clear  9.02
2  spring     0      1     2   False        6      False   clear  9.02
3  spring     0      1     3   False        6      False   clear  9.84
4  spring     0      1     4   False        6      False   clear  9.84

   feel_temp  humidity  windspeed  count
0     14.395      0.81        0.0     16
1     13.635      0.80        0.0     40
2     13.635      0.80        0.0     32
3     14.395      0.75        0.0     13
4     14.395      0.75        0.0      1
要使用 Scikit-learn 进行循环编码,我们可以使用 FunctionTransformer:
def sin_transformer(period):
    return FunctionTransformer(lambda x: np.sin(x / period * 2 * np.pi))

def cos_transformer(period):
    return FunctionTransformer(lambda x: np.cos(x / period * 2 * np.pi))
要将此转换应用于具有不同最大值的多个变量,我们可以在 ColumnTransformer 的实例中组合转换器:
cyclic_cossin_transformer = ColumnTransformer(
    transformers=[
        ("month_sin", sin_transformer(12), ["month"]),
        ("month_cos", cos_transformer(12), ["month"]),
        ("weekday_sin", sin_transformer(7), ["weekday"]),
        ("weekday_cos", cos_transformer(7), ["weekday"]),
        ("hour_sin", sin_transformer(24), ["hour"]),
        ("hour_cos", cos_transformer(24), ["hour"]),
    ],
).set_output(transform="pandas")
现在我们可以获取循环编码的特征:
Xt = cyclic_cossin_transformer.fit_transform(df)

print(Xt)
在以下输出中,我们看到了变量月份、星期几和小时的正弦和余弦特征:
       month_sin__month  month_cos__month  weekday_sin__weekday  \
0          5.000000e-01          0.866025             -0.781831
1          5.000000e-01          0.866025             -0.781831
2          5.000000e-01          0.866025             -0.781831
3          5.000000e-01          0.866025             -0.781831
4          5.000000e-01          0.866025             -0.781831
...                 ...               ...                   ...
17374     -2.449294e-16          1.000000              0.781831
17375     -2.449294e-16          1.000000              0.781831
17376     -2.449294e-16          1.000000              0.781831
17377     -2.449294e-16          1.000000              0.781831
17378     -2.449294e-16          1.000000              0.781831

       weekday_cos__weekday  hour_sin__hour  hour_cos__hour
0                   0.62349        0.000000        1.000000
1                   0.62349        0.258819        0.965926
2                   0.62349        0.500000        0.866025
3                   0.62349        0.707107        0.707107
4                   0.62349        0.866025        0.500000
...                     ...             ...             ...
17374               0.62349       -0.965926        0.258819
17375               0.62349       -0.866025        0.500000
17376               0.62349       -0.707107        0.707107
17377               0.62349       -0.500000        0.866025
17378               0.62349       -0.258819        0.965926

[17379 rows x 6 columns]
使用 Feature-engine,我们可以执行如下相同的操作:
tr = CyclicalFeatures(drop_original=True)
Xt = tr.fit_transform(df[["month", "weekday", "hour"]])

print(Xt)
请注意,通过较少的代码行,我们获得了类似的结果:
          month_sin  month_cos   weekday_sin  weekday_cos      hour_sin  \
0      5.000000e-01   0.866025 -2.449294e-16          1.0  0.000000e+00
1      5.000000e-01   0.866025 -2.449294e-16          1.0  2.697968e-01
2      5.000000e-01   0.866025 -2.449294e-16          1.0  5.195840e-01
3      5.000000e-01   0.866025 -2.449294e-16          1.0  7.308360e-01
4      5.000000e-01   0.866025 -2.449294e-16          1.0  8.878852e-01
...             ...        ...           ...          ...           ...
17374 -2.449294e-16   1.000000  8.660254e-01          0.5 -8.878852e-01
17375 -2.449294e-16   1.000000  8.660254e-01          0.5 -7.308360e-01
17376 -2.449294e-16   1.000000  8.660254e-01          0.5 -5.195840e-01
17377 -2.449294e-16   1.000000  8.660254e-01          0.5 -2.697968e-01
17378 -2.449294e-16   1.000000  8.660254e-01          0.5 -2.449294e-16

       hour_cos
0      1.000000
1      0.962917
2      0.854419
3      0.682553
4      0.460065
...         ...
17374  0.460065
17375  0.682553
17376  0.854419
17377  0.962917
17378  1.000000

[17379 rows x 6 columns]
然而,需要注意的是,数据框并不相同,因为默认情况下,CyclicalFeatures() 会将变量除以其最大值:
tr.max_values_
在默认实现中,我们将变量 weekday 除以 6 而不是 7,将变量 hour 除以 23 而不是 24,因为这些变量的值分别在 0 到 6 和 0 到 23 之间变化。
{'month': 12, 'weekday': 6, 'hour': 23}
实际上,Scikit-learn 和 Feature-engine 返回的数据帧的值之间没有太大差异,我怀疑这种微小的差异不会导致模型性能的重大变化。
然而,如果你想分别将变量 weekday 和 hour 除以 7 和 24,你可以这样做:
tr = CyclicalFeatures(
    max_values={"month": 12, "weekday": 7, "hour": 24},
    drop_original=True,
)
Xt = tr.fit_transform(df[["month", "weekday", "hour"]])

print(Xt)
现在,数据框的值是相同的:
          month_sin  month_cos  weekday_sin  weekday_cos  hour_sin  hour_cos
0      5.000000e-01   0.866025    -0.781831      0.62349  0.000000  1.000000
1      5.000000e-01   0.866025    -0.781831      0.62349  0.258819  0.965926
2      5.000000e-01   0.866025    -0.781831      0.62349  0.500000  0.866025
3      5.000000e-01   0.866025    -0.781831      0.62349  0.707107  0.707107
4      5.000000e-01   0.866025    -0.781831      0.62349  0.866025  0.500000
...             ...        ...          ...          ...       ...       ...
17374 -2.449294e-16   1.000000     0.781831      0.62349 -0.965926  0.258819
17375 -2.449294e-16   1.000000     0.781831      0.62349 -0.866025  0.500000
17376 -2.449294e-16   1.000000     0.781831      0.62349 -0.707107  0.707107
17377 -2.449294e-16   1.000000     0.781831      0.62349 -0.500000  0.866025
17378 -2.449294e-16   1.000000     0.781831      0.62349 -0.258819  0.965926

[17379 rows x 6 columns]
最终,选择循环编码的正确周期是用户的责任,通过自动化,我们只能做到这一步。
附加资源#
关于如何创建循环特征的教程,请查看以下课程:

机器学习的特征工程#

时间序列预测的特征工程#
要比较独热编码、序数编码、循环编码和样条编码的循环特征,请查看以下 sklearn 演示。
也可以查看这些关于在神经网络中使用循环编码的Kaggle演示:
