SelectBySingleFeaturePerformance#
SelectBySingleFeaturePerformance() 根据每个特征单独训练的机器学习模型的性能来选择特征。换句话说,它识别出那些本身具有强大预测能力的特征。选择过程如下:
每次仅使用一个特征来训练一个单独的机器学习模型。
使用选定的性能指标评估每个模型。
保留性能超过指定阈值的特性。
如果 threshold 参数设置为 None,算法将选择性能高于所有单个特征平均值的特征。
Python 示例#
让我们看看如何使用 SelectBySingleFeaturePerformance() 与 Scikit-learn 自带的糖尿病数据集。首先,我们加载数据:
import pandas as pd
import matplotlib.pyplot as plt
from sklearn.datasets import load_diabetes
from sklearn.linear_model import LinearRegression
from feature_engine.selection import SelectBySingleFeaturePerformance

X, y = load_diabetes(return_X_y=True, as_frame=True)
print(X.head())
在以下输出中,我们看到了糖尿病数据集:
        age       sex       bmi        bp        s1        s2        s3  \
0  0.038076  0.050680  0.061696  0.021872 -0.044223 -0.034821 -0.043401
1 -0.001882 -0.044642 -0.051474 -0.026328 -0.008449 -0.019163  0.074412
2  0.085299  0.050680  0.044451 -0.005670 -0.045599 -0.034194 -0.032356
3 -0.089063 -0.044642 -0.011595 -0.036656  0.012191  0.024991 -0.036038
4  0.005383 -0.044642 -0.036385  0.021872  0.003935  0.015596  0.008142

         s4        s5        s6
0 -0.002592  0.019907 -0.017646
1 -0.039493 -0.068332 -0.092204
2 -0.002592  0.002861 -0.025930
3  0.034309  0.022688 -0.009362
4 -0.002592 -0.031988 -0.046641
让我们设置 SelectBySingleFeaturePerformance() 来根据线性回归返回的 r2 选择特征,使用 3 折交叉验证。我们希望选择 r2 > 0.01 的特征。
# initialize feature selector
sel = SelectBySingleFeaturePerformance(
        estimator=LinearRegression(), scoring="r2", cv=3, threshold=0.01)
使用 fit() 方法,转换器为每个特征拟合一个模型,确定性能并选择重要特征:
# fit transformer
sel.fit(X, y)
将被移除的功能存储在以下属性中:
sel.features_to_drop_
只有一个特征将被丢弃,因为使用该特征训练的线性模型的r2小于0.1:
[sex]
评估特征重要性#
SelectBySingleFeaturePerformance() 存储了每个单一特征模型的性能:
sel.feature_performance_
在以下输出中,我们看到了使用字典键中特征训练的每个线性回归的 r2:
{'age': 0.029231969375784466,
 'sex': -0.003738551760264386,
 'bmi': 0.33662080998769284,
 'bp': 0.19218913007834937,
 's1': 0.037115559827549806,
 's2': 0.017854228256932614,
 's3': 0.1515388617752689,
 's4': 0.1772160996650173,
 's5': 0.31494478799681097,
 's6': 0.13876602125792703}
我们也可以如下检查 r2 的标准差:
sel.feature_performance_std_
在以下输出中,我们可以看到标准差:
{'age': 0.017870583127141664,
 'sex': 0.005465336770744777,
 'bmi': 0.04257342727445452,
 'bp': 0.027318947204928765,
 's1': 0.031397211603399186,
 's2': 0.03224477055466249,
 's3': 0.020243573053986438,
 's4': 0.04782262499458294,
 's5': 0.02473650354444323,
 's6': 0.029051175300521623}
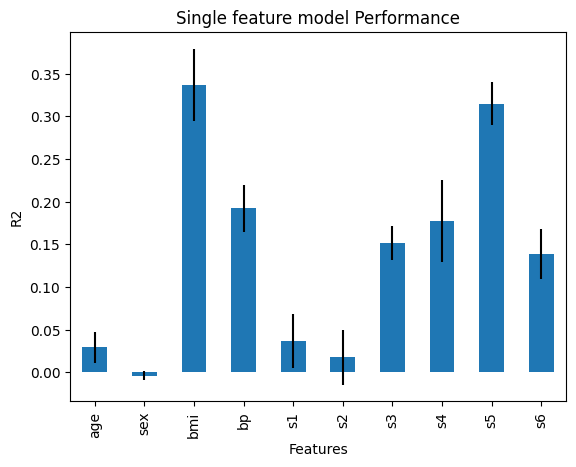
我们可以将性能与标准差一起绘制,以更好地了解模型性能的变异性:
r = pd.concat([
    pd.Series(sel.feature_performance_),
    pd.Series(sel.feature_performance_std_)
], axis=1
)
r.columns = ['mean', 'std']

r['mean'].plot.bar(yerr=[r['std'], r['std']], subplots=True)

plt.title("Single feature model Performance")
plt.ylabel('R2')
plt.xlabel('Features')
plt.show()
在下图中,我们可以看到单一特征模型的性能:

通过这个,我们可以更好地理解特征与目标变量之间的关系,基于线性回归模型。
检查生成的数据框#
通过 transform() 我们继续并从数据集中移除特征:
# drop variables
Xt = sel.transform(X)
我们现在可以打印转换后的数据:
print(Xt.head())
在以下输出中,我们可以看到选定的功能:
        age       bmi        bp        s1        s2        s3        s4  \
0  0.038076  0.061696  0.021872 -0.044223 -0.034821 -0.043401 -0.002592
1 -0.001882 -0.051474 -0.026328 -0.008449 -0.019163  0.074412 -0.039493
2  0.085299  0.044451 -0.005670 -0.045599 -0.034194 -0.032356 -0.002592
3 -0.089063 -0.011595 -0.036656  0.012191  0.024991 -0.036038  0.034309
4  0.005383 -0.036385  0.021872  0.003935  0.015596  0.008142 -0.002592

         s5        s6
0  0.019907 -0.017646
1 -0.068332 -0.092204
2  0.002861 -0.025930
3  0.022688 -0.009362
4 -0.031988 -0.046641


