ProbeFeatureSelection#
ProbeFeatureSelection() 向数据框中添加一个或多个随机变量。接下来,它推导出每个变量的特征重要性,包括探针特征。最后,它移除那些重要性低于探针的特征。
推导特征重要性#
ProbeFeatureSelection() 有两种策略来推导特征重要性。
在 collective 策略中,ProbeFeatureSelection() 使用所有变量加上探针特征训练一个机器学习模型,然后从拟合的模型中推导出特征重要性。这种特征重要性由线性模型的系数或基于树的算法推导出的特征重要性给出。
在 individual feature 策略中,ProbeFeatureSelection() 为每个特征和每个探测器训练一个机器学习模型,然后,特征的重要性由该单一特征模型的性能给出。这里,重要性由您选择的任何性能指标给出。
两种策略各有优缺点。如果特征是相关的,线性模型系数返回的特征重要性值,或从决策树中得出的特征重要性值,将显得比单独使用该特征训练模型时更小。因此,由于相关性导致的这些看似较低的重要性值,可能会导致潜在重要特征在探测中被忽略。
另一方面,使用单独特征训练模型,无法检测特征交互,也无法去除冗余变量。
此外,请记住,基于树的模型的重要性偏向于高基数的特征。因此,连续特征似乎比离散变量更重要。如果你的特征是离散的,而你的探测是连续的,你可能会意外地移除重要的特征。
选择特征#
在为每个特征(包括探针)分配一个特征重要性值之后,ProbeFeatureSelection() 将选择那些重要性大于所有探针平均重要性的变量。
特征选择过程#
这是 ProbeFeatureSelection() 如何使用 collective 策略选择特征的方式:
向数据集中添加1个或更多随机特征
使用所有特征(包括随机特征)训练机器学习模型
从拟合的模型中推导特征重要性
取随机特征的平均重要性
选择重要性大于随机变量重要性的特征(步骤4)
这是 ProbeFeatureSelection() 如何使用 individual feature 策略选择特征的方法:
向数据集中添加1个或更多随机特征
按特征和按探针训练机器学习
将特征重要性确定为单特征模型的性能
取随机特征的平均重要性
选择重要性大于随机变量重要性的特征(步骤4)
探针功能选择的理由#
特征选择的主要目标之一是从数据集中去除噪声。一个随机生成的变量,即探针特征,本质上具有高水平的噪声。因此,任何重要性低于探针特征的变量都被认为是噪声,并可以从数据集中丢弃。
探测器功能的分布#
在初始化 ProbeFeatureSelection() 类时,您可以选择假设哪种分布来创建探针特征,以及要创建的探针特征的数量。
可能的分布有 ‘normal’、’binary’、’uniform’ 或 ‘all’。’all’ 会创建一个或多个探针特征,包含每种分布类型,即 normal、binomial 和 uniform。因此,如果你选择了 ‘all’ 并创建了 9 个探针特征,你将每种分布有 3 个探针。
分布很重要。基于树的模型往往更重视高基数的特征。因此,在使用这些模型时,从均匀分布或正态分布创建的探针显示的重要性将大于从二项分布提取的探针。
Python 示例#
让我们看看如何使用这个转换器从加州大学欧文分校的威斯康星州乳腺癌(诊断)数据集中选择变量,该数据集可以在 这里 找到。我们将使用 Scikit-learn 来加载数据集。该数据集涉及乳腺癌诊断。目标变量是二元的,即恶性或良性。数据仅由数值数据组成。
让我们导入所需的库和类:
import pandas as pd
from sklearn.datasets import load_breast_cancer
from sklearn.ensemble import RandomForestClassifier
from sklearn.model_selection import train_test_split
from feature_engine.selection import ProbeFeatureSelection
现在让我们加载癌症诊断数据:
cancer_X, cancer_y = load_breast_cancer(return_X_y=True, as_frame=True)
让我们检查一下 cancer_X 的形状:
print(cancer_X.shape)
我们看到数据集由569个观测值和30个特征组成:
(569, 30)
现在让我们将数据分为训练集和测试集:
# separate train and test sets
X_train, X_test, y_train, y_test = train_test_split(
    cancer_X,
    cancer_y,
    test_size=0.2,
    random_state=3
)

X_train.shape, X_test.shape
我们看到了以下数据集的大小。请注意,训练集和测试集各有30个特征。
((455, 30), (114, 30))
现在,我们设置 ProbeFeatureSelection() 以使用 collective 策略来选择特征。
我们将传递 RandomForestClassifier() 作为 estimator。我们将使用 precision 作为 scoring 参数,并将 5 作为 cv 参数,这两个参数将在交叉验证中使用。
在这个例子中,我们将介绍一个具有正态分布的随机特征。因此,我们为 n_probes 参数传递 1,并将 normal 作为 distribution。
sel = ProbeFeatureSelection(
    estimator=RandomForestClassifier(),
    variables=None,
    scoring="precision",
    n_probes=1,
    distribution="normal",
    cv=5,
    random_state=150,
    confirm_variables=False
)

sel.fit(X_train, y_train)
使用 fit(),转换器:
使用提供的分布创建
n_probes数量的探针特征使用交叉验证来拟合提供的估计器
计算每个变量的特征重要性得分,包括探针特征
如果有多个探测特征,转换器会计算平均重要性分数
识别那些重要性评分低于探针特征的特征,因为它们将被丢弃。
分析探测器#
在属性 probe_features 中,我们找到伪随机生成的变量:
sel.probe_features_.head()
       gaussian_probe_0
0         -0.694150
1          1.171840
2          1.074892
3          1.698733
4          0.498702
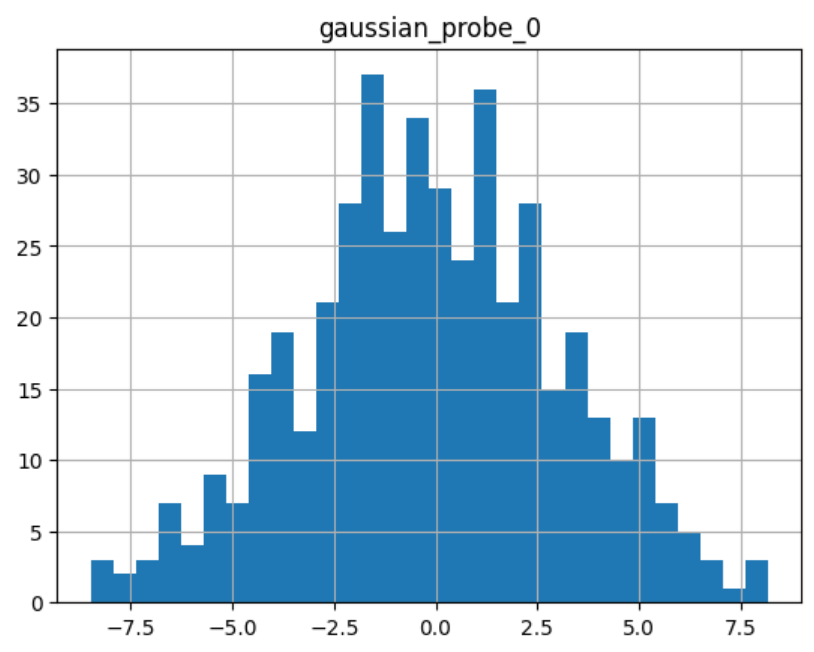
我们可以继续显示探针特征的直方图:
sel.probe_features_.hist(bins=30)
正如我们所见,它显示了一个正态分布:
分析特征重要性#
属性 feature_importances_ 显示了每个变量的特征重要性:
sel.feature_importances_.head()
以下是前5个特性的重要性:
mean radius        0.058463
mean texture       0.011953
mean perimeter     0.069516
mean area          0.050947
mean smoothness    0.004974
dtype: float64
在系列结束时,我们看到了探测功能的重要性:
sel.feature_importances_.tail()
以下是包括探测器在内的最后5个特性的重要性:
worst concavity            0.037844
worst concave points       0.102769
worst symmetry             0.011587
worst fractal dimension    0.007456
gaussian_probe_0           0.003783
dtype: float64
在属性 feature_importances_std_ 中,我们找到特征重要性的标准差,这可以用于数据分析:
sel.feature_importances_std_.head()
这是前5个特征的标准差:
mean radius        0.013648
mean texture       0.002571
mean perimeter     0.025189
mean area          0.010173
mean smoothness    0.001650
dtype: float64
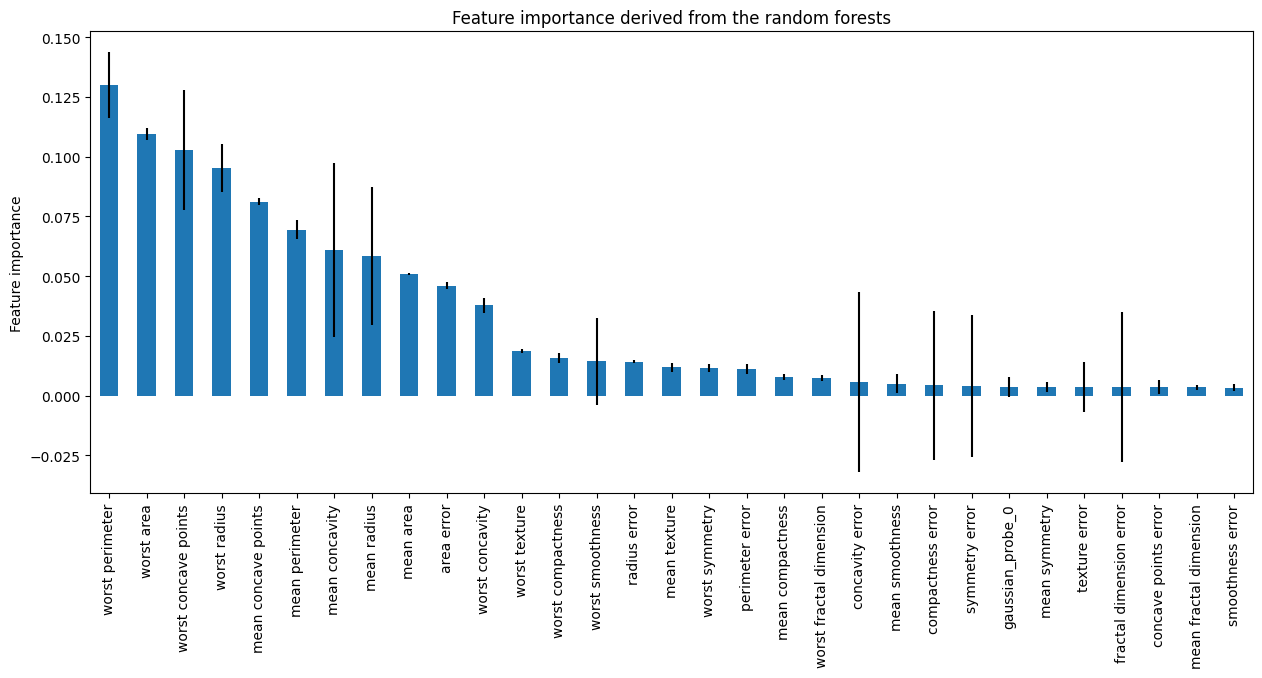
我们可以继续绘制条形图,显示特征重要性和标准差:
r = pd.concat([
    sel.feature_importances_,
    sel.feature_importances_std_
], axis=1)

r.columns = ["mean", "std"]

r.sort_values("mean", ascending=False)["mean"].plot.bar(
    yerr=[r['std'], r['std']], subplots=True, figsize=(15,6)
)
plt.title("Feature importance derived from the random forests")
plt.ylabel("Feature importance")
plt.show()
在下图中,我们看到了每个特征的重要性,包括探针:
选定的功能#
在属性 features_to_drop_ 中,我们找到未被选择的变量:
sel.features_to_drop_
这些是从数据框中将被移除的变量:
['mean symmetry',
 'mean fractal dimension',
 'texture error',
 'smoothness error',
 'concave points error',
 'fractal dimension error']
我们看到 features_to_drop_ 的特征重要性得分低于探针特征的得分:
sel.feature_importances_.loc[sel.features_to_drop_+["gaussian_probe_0"]]
上一个命令返回以下输出:
mean symmetry              0.003698
mean fractal dimension     0.003455
texture error              0.003595
smoothness error           0.003333
concave points error       0.003548
fractal dimension error    0.003576
gaussian_probe_0           0.003783
从数据中删除特征#
使用 transform(),我们可以继续删除特征重要性得分小于 gaussian_probe_0 变量的六个特征:
Xtr = sel.transform(X_test)

Xtr.shape
移除特征后数据的最终形态:
(114, 24)
获取生成的特征名称#
最后,我们还可以获取最终转换后的数据集中特征的名称:
sel.get_feature_names_out()
在以下输出中,我们看到了转换后的数据集中将包含的功能名称:
['mean radius',
 'mean texture',
 'mean perimeter',
 'mean area',
 'mean smoothness',
 'mean compactness',
 'mean concavity',
 'mean concave points',
 'radius error',
 'perimeter error',
 'area error',
 'compactness error',
 'concavity error',
 'symmetry error',
 'worst radius',
 'worst texture',
 'worst perimeter',
 'worst area',
 'worst smoothness',
 'worst compactness',
 'worst concavity',
 'worst concave points',
 'worst symmetry',
 'worst fractal dimension']
为了与 Scikit-learn 选择转换器兼容,ProbeFeatureSelection() 也支持 get_support() 方法:
sel.get_support()
返回以下输出:
[True, True, True, True, True, True, True, True, False, False, True, False, True,
 True, False, True, True, False, True, False, True, True, True, True, True, True,
 True, True, True, True]
使用多个探测功能#
现在让我们重复选择过程,但使用超过1个探针特征。
sel = ProbeFeatureSelection(
    estimator=RandomForestClassifier(),
    variables=None,
    scoring="precision",
    n_probes=3,
    distribution="all",
    cv=5,
    random_state=150,
    confirm_variables=False
)

sel.fit(X_train, y_train)
让我们展示转换器创建的随机特征:
sel.probe_features_.head()
这里我们找到一些探针特性的示例值:
   gaussian_probe_0  binary_probe_0  uniform_probe_0
0         -0.694150               1         0.983610
1          1.171840               1         0.765628
2          1.074892               1         0.991439
3          1.698733               0         0.668574
4          0.498702               0         0.192840
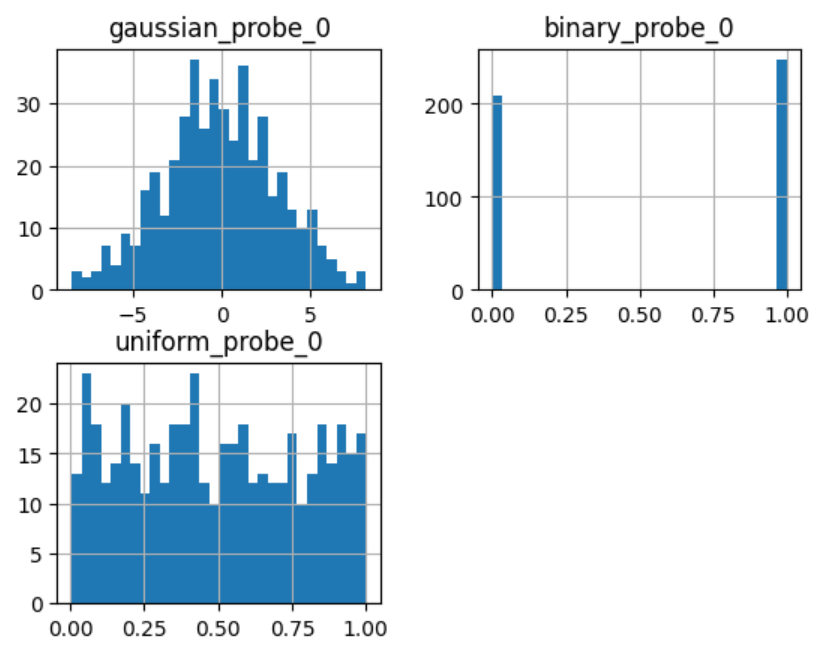
让我们继续绘制直方图:
sel.probe_features_.hist(bins=30)
plt.show()
在直方图中,我们识别出3个定义明确的分布:
让我们展示随机特征的重要性
sel.feature_importances_.tail()
worst symmetry             0.009176
worst fractal dimension    0.007825
gaussian_probe_0           0.003765
binary_probe_0             0.000354
uniform_probe_0            0.002377
dtype: float64
我们看到二进制特征的重要性极低,因此,当我们取平均值时,数值非常小,以至于没有特征会被丢弃(记得随机森林倾向于高基数特征吗?):
sel.features_to_drop_
上一个命令返回一个空列表:
[]
在尝试移除变量时,选择合适的探针特征分布非常重要。如果大多数变量是连续的,引入具有正态分布和均匀分布的特征。如果你有一热编码特征或稀疏矩阵,二进制特征可能是更好的选择。
使用个别功能策略#
现在我们将重复这个过程,但这次我们将为每个特征训练一个随机森林,并使用 roc-auc 作为特征重要性的衡量标准:
sel = ProbeFeatureSelection(
    estimator=RandomForestClassifier(n_estimators=5, random_state=1),
    variables=None,
    collective=False,
    scoring="roc_auc",
    n_probes=3,
    distribution="all",
    cv=5,
    random_state=150,
    confirm_variables=False
)

sel.fit(X_train, y_train)
我们现在可以继续绘制特征重要性,包括探针的重要性:
r = pd.concat([
    sel.feature_importances_,
    sel.feature_importances_std_
], axis=1)

r.columns = ["mean", "std"]

r.sort_values("mean", ascending=False)["mean"].plot.bar(
    yerr=[r['std'], r['std']], subplots=True, figsize=(15,6)
)
plt.title("Feature importance derived from single feature models")
plt.ylabel("Feature importance - roc-auc")
plt.show()
在下图中,我们看到了特征重要性,包括探针:
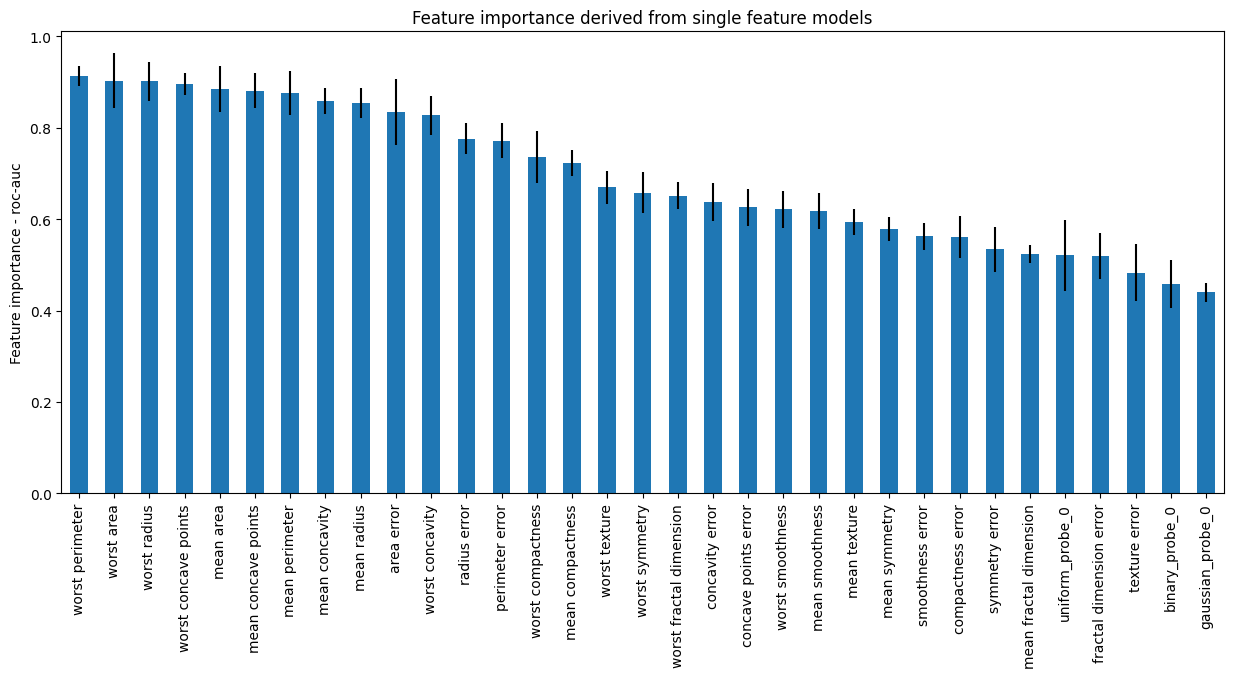
当单独评估时,每个特征似乎都具有更大的重要性。请注意,许多特征的 roc-auc 与探针的 roc-auc 没有显著差异(误差条重叠)。因此,即使转换器不会丢弃这些特征,我们也可以在分析此图后决定丢弃它们。
其他资源#
有关此方法的更多信息可以在以下资源中找到:
Kaggle 特征工程与选择技巧, 作者:Gilberto Titericz。
特征选择:超越特征重要性?, KDDNuggets.
有关此功能选择方法及其他方法的更多详细信息,请查看以下资源:

机器学习的特征选择#
或者阅读我们的书:
机器学习中的特征选择#
我们的书籍和课程都适合初学者和更高级的数据科学家。通过购买它们,您正在支持 Feature-engine 的主要开发者 Sole。
