备注
转到末尾 下载完整示例代码。或者通过 Binder 在浏览器中运行此示例。
估计3D显微镜图像中的各向异性#
在本教程中,我们计算一个3D图像的结构张量。关于3D图像处理的一般介绍,请参阅 探索3D图像(细胞)。我们在这里使用的数据是从通过共聚焦荧光显微镜获得的肾组织图像中采样的(更多细节见 [1] 下的 kidney-tissue-fluorescence.tif)。
import matplotlib.pyplot as plt
import numpy as np
import plotly.express as px
import plotly.io

from skimage import data, feature
加载图像#
这张生物医学图像可通过 scikit-image 的数据注册表获取。
data = data.kidney()
我们的3D多通道图像的确切形状和大小是什么?
print(f'number of dimensions: {data.ndim}')
print(f'shape: {data.shape}')
print(f'dtype: {data.dtype}')
number of dimensions: 4
shape: (16, 512, 512, 3)
dtype: uint16
在本教程中,我们将仅考虑第二个颜色通道,这将使我们得到一个3D单通道图像。值的范围是什么?
range: (68, 4095)
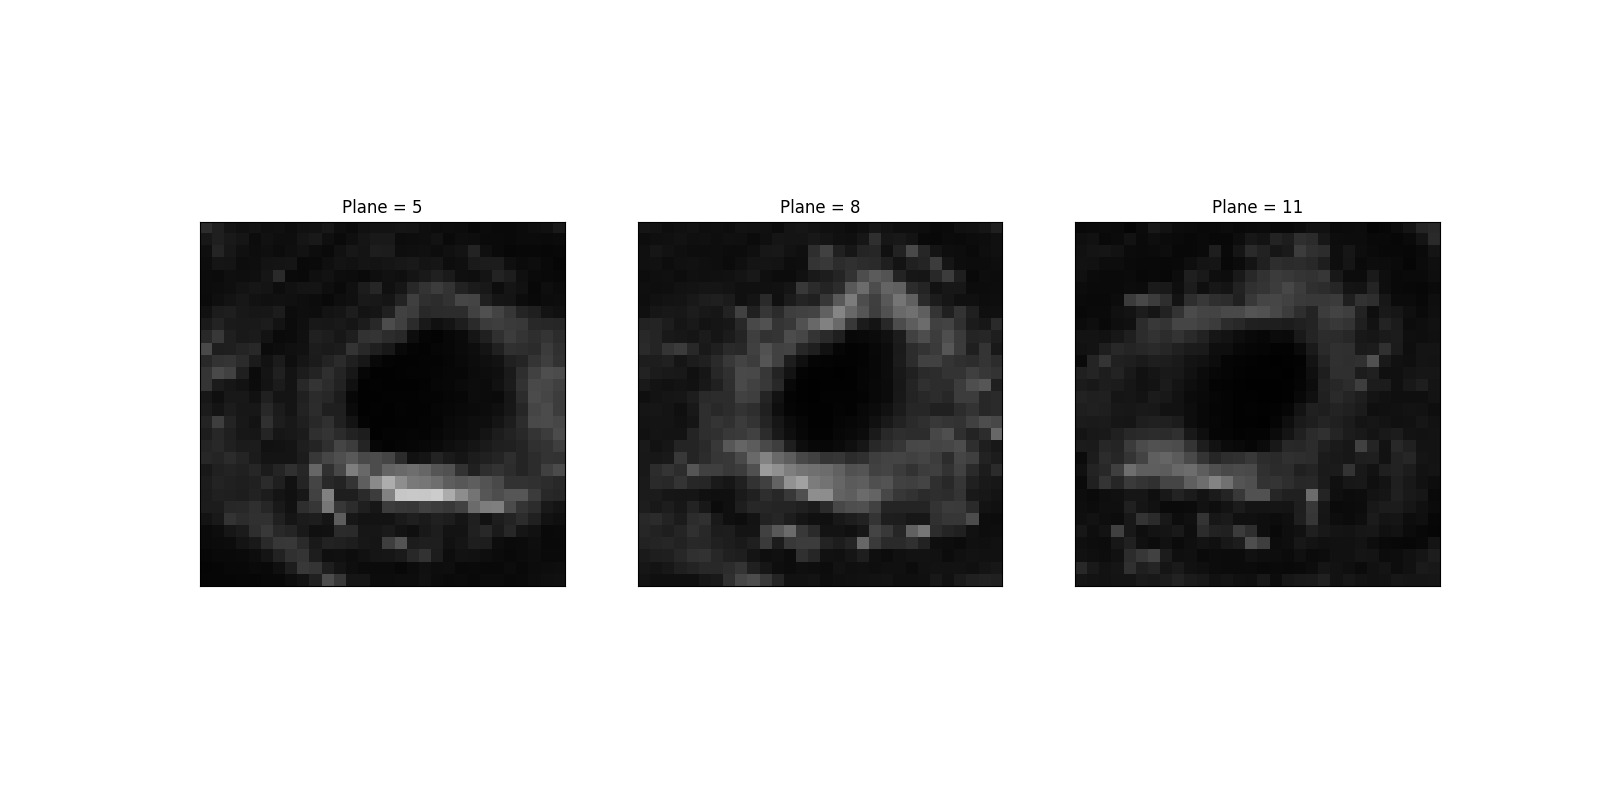
让我们可视化我们3D图像的中间切片。
让我们选择一个特定的区域,该区域显示出相对的 X-Y 各向同性。相比之下,沿 Z 方向的梯度则大不相同(并且,就此而言,较弱)。
sample = data[5:13, 380:410, 370:400, 1]
step = 3
cols = sample.shape[0] // step + 1
_, axes = plt.subplots(nrows=1, ncols=cols, figsize=(16, 8))

for it, (ax, image) in enumerate(zip(axes.flatten(), sample[::step])):
    ax.imshow(image, cmap='gray', vmin=v_min, vmax=v_max)
    ax.set_title(f'Plane = {5 + it * step}')
    ax.set_xticks([])
    ax.set_yticks([])

要查看3D样例数据,请运行以下代码:
import plotly.graph_objects as go

(n_Z, n_Y, n_X) = sample.shape
Z, Y, X = np.mgrid[:n_Z, :n_Y, :n_X]

fig = go.Figure(
    data=go.Volume(
        x=X.flatten(),
        y=Y.flatten(),
        z=Z.flatten(),
        value=sample.flatten(),
        opacity=0.5,
        slices_z=dict(show=True, locations=[4])
    )
)
fig.show()
计算结构张量#
让我们可视化样本数据的底部切片,并确定强变化的典型大小。我们将使用这个大小作为窗口函数的’宽度’。
关于最亮的区域(即在第 ~ 22 行和第 ~ 17 列),我们可以看到在列(或行)上跨越 2 或 3(分别 1 或 2)像素的变化(因此,强烈的梯度)。因此,我们可以选择,例如,sigma = 1.5 作为窗口函数。或者,我们可以基于每个轴传递 sigma,例如,sigma = (1, 2, 3)。请注意,沿第一个(Z,平面)轴的大小 1 听起来是合理的,因为后者的大小为 8(13 - 5)。在 X-Z 或 Y-Z 平面上查看切片证实了这一点是合理的。
然后我们可以计算结构张量的特征值。
(3, 8, 30, 30)
最大的特征值在哪里?
coords = np.unravel_index(eigen.argmax(), eigen.shape)
assert coords[0] == 0  # by definition
coords
(np.int64(0), np.int64(1), np.int64(22), np.int64(16))
备注
读者可以检查这个结果(坐标 (plane, row, column) = coords[1:])对变化的 sigma 有多稳健。
让我们查看在 X-Y 平面上特征值的空间分布,其中最大特征值被找到(即,Z = coords[1])。
我们正在观察一个局部属性。让我们考虑在上述X-Y平面上围绕最大特征值的一个微小邻域。
array([[0.05530323, 0.05929082, 0.06043806],
       [0.05922725, 0.06268274, 0.06354238],
       [0.06190861, 0.06685075, 0.06840962]])
如果我们检查这个邻域中的第二大特征值,我们可以看到它们与最大的特征值具有相同的数量级。
array([[0.03577746, 0.03577334, 0.03447714],
       [0.03819524, 0.04172036, 0.04323701],
       [0.03139592, 0.03587025, 0.03913327]])
相比之下,第三大的特征值要小一个数量级。
array([[0.00337661, 0.00306529, 0.00276288],
       [0.0041869 , 0.00397519, 0.00375595],
       [0.00479742, 0.00462116, 0.00442455]])
让我们在X-Y平面上可视化样本数据的一部分,其中找到最大特征值。
让我们在X-Z(左)和Y-Z(右)平面上可视化样本数据的切片,其中最大特征值被找到。Z轴是下面子图中的垂直轴。我们可以看到沿Z轴的预期相对不变性(对应于肾脏组织中的纵向结构),特别是在Y-Z平面上(longitudinal=1)。
总之,关于体素 (plane, row, column) = coords[1:] 的区域在三维上是各向异性的:一方面是第三大特征值,另一方面是最大和第二大特征值,它们之间有一个数量级的差异。我们可以在图 Eigenvalues for plane Z = 1 中一眼看出这一点。
所讨论的邻域在平面内是’某种各向同性’的(在这里,平面相对接近于X-Y平面):第二大和最大特征值之间的因子小于2。这一描述与我们从图像中看到的情况相符,即在某一方向(在这里,相对接近于行轴)上存在较强的梯度,而在与其垂直的方向上存在较弱的梯度。
在三维结构张量的椭球体表示中 [2] ,我们会遇到薄饼情况。
https://en.wikipedia.org/wiki/Structure_tensor#Interpretation_2
脚本总运行时间: (0 分钟 0.966 秒)
