备注
前往结尾 下载完整示例代码。或在浏览器中通过 Binder 运行此示例。
分割人类细胞(在有丝分裂中)#
在这个例子中,我们分析了一张人类细胞的显微镜图像。我们使用了Jason Moffat [1] 通过 CellProfiler 提供的数据。
import matplotlib.pyplot as plt
import numpy as np
from scipy import ndimage as ndi

import skimage as ski

image = ski.data.human_mitosis()

fig, ax = plt.subplots()
ax.imshow(image, cmap='gray')
ax.set_title('Microscopy image of human cells stained for nuclear DNA')
plt.show()
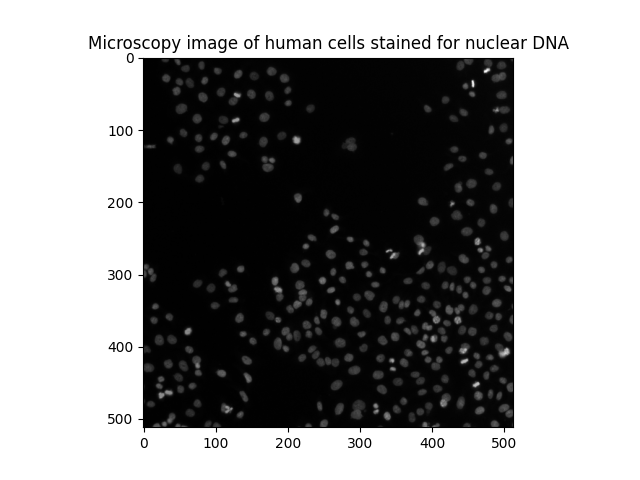
我们可以在深色背景上看到许多细胞核。它们大多数是光滑的,呈椭圆形。然而,我们可以区分出一些更亮的斑点,对应于正在进行 有丝分裂 (细胞分裂)的细胞核。
另一种可视化灰度图像的方法是等高线绘图:
fig, ax = plt.subplots(figsize=(5, 5))
qcs = ax.contour(image, origin='image')
ax.set_title('Contour plot of the same raw image')
plt.show()
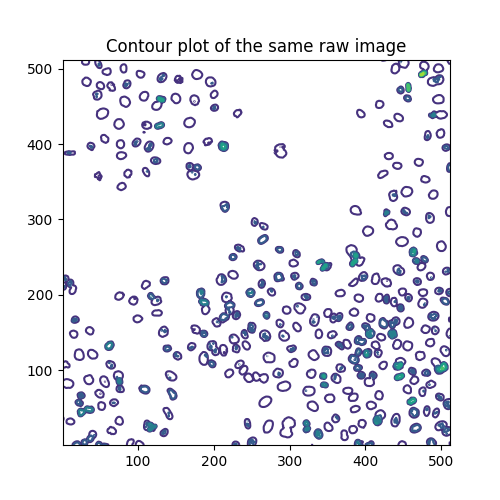
等高线在这些水平上绘制:
array([ 0., 40., 80., 120., 160., 200., 240., 280.])
每个级别分别有以下数量的段落:
[len(seg) for seg in qcs.allsegs]
[1, 320, 270, 48, 19, 3, 1, 1]
估计有丝分裂指数#
细胞生物学使用 有丝分裂指数 来量化细胞分裂,从而量化细胞增殖。根据定义,它是有丝分裂细胞数与总细胞数的比率。为了分析上述图像,我们因此对两个阈值感兴趣:一个用于区分细胞核与背景,另一个用于区分正在分裂的细胞核(较亮的点)与未分裂的细胞核。为了分离这三种不同类别的像素,我们求助于 多Otsu阈值化。
thresholds = ski.filters.threshold_multiotsu(image, classes=3)
regions = np.digitize(image, bins=thresholds)

fig, ax = plt.subplots(ncols=2, figsize=(10, 5))
ax[0].imshow(image)
ax[0].set_title('Original')
ax[0].set_axis_off()
ax[1].imshow(regions)
ax[1].set_title('Multi-Otsu thresholding')
ax[1].set_axis_off()
plt.show()
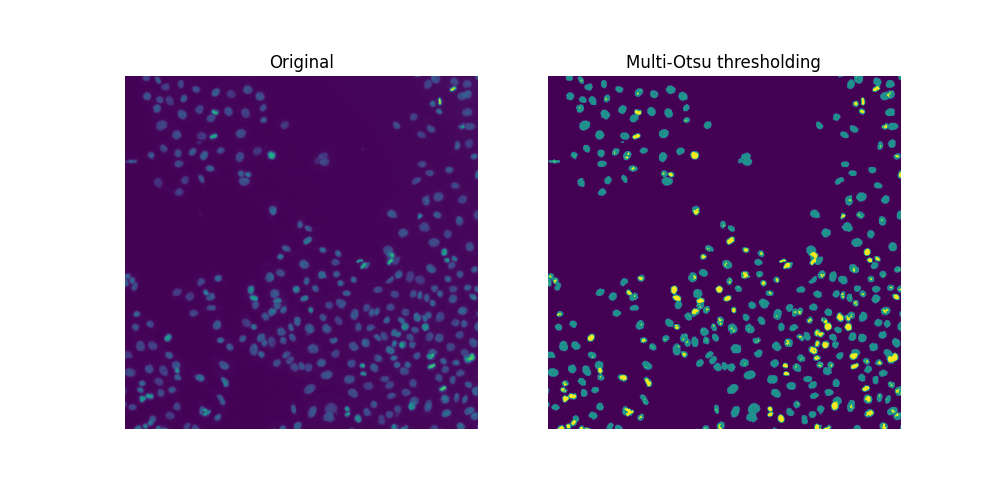
由于存在重叠的细胞核,仅靠阈值分割不足以分割所有细胞核。如果是这样,我们可以很容易地为这个样本计算有丝分裂指数:
cells = image > thresholds[0]
dividing = image > thresholds[1]
labeled_cells = ski.measure.label(cells)
labeled_dividing = ski.measure.label(dividing)
naive_mi = labeled_dividing.max() / labeled_cells.max()
print(naive_mi)
0.7847222222222222
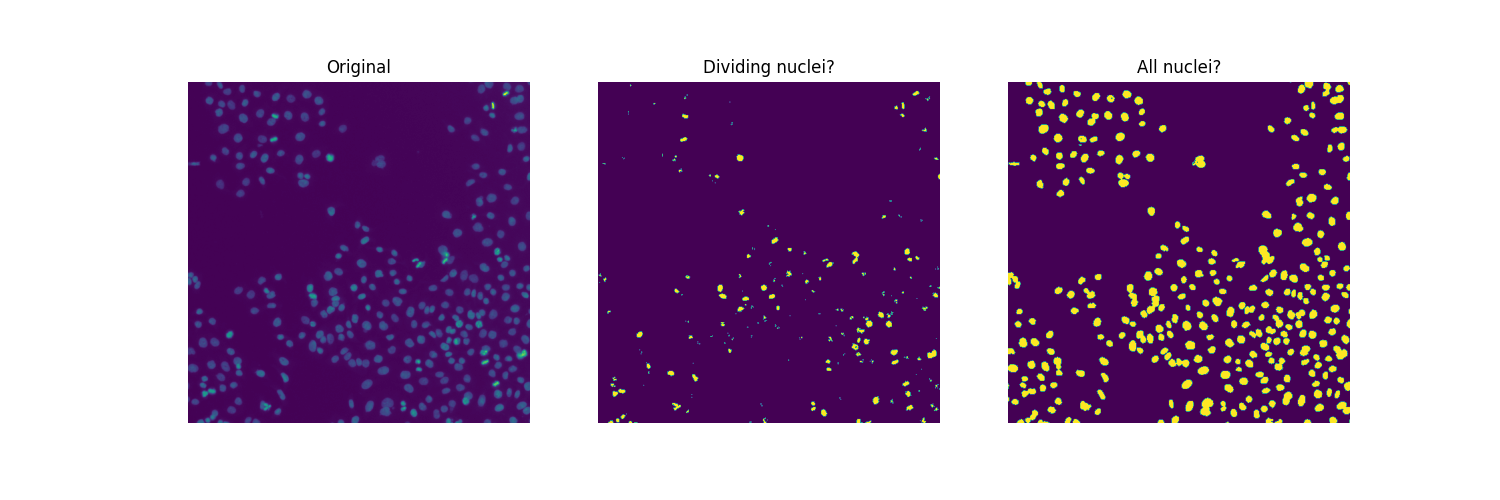
哇,这不可能!分裂核的数量
print(labeled_dividing.max())
226
被高估了,而细胞总数
print(labeled_cells.max())
288
被低估了。
计数分裂的细胞核#
显然,中间图中并非所有连接的区域都是正在分裂的细胞核。一方面,第二个阈值(thresholds[1] 的值)似乎太低,无法将那些非常亮的区域(对应于正在分裂的细胞核)与许多细胞核中存在的相对较亮的像素分开。另一方面,我们希望得到一个更平滑的图像,去除小的虚假物体,并可能合并相邻物体的集群(其中一些可能对应于从一个细胞分裂出来的两个细胞核)。在某种程度上,我们面临的细胞核分裂的分割挑战与(接触的)细胞的分割挑战是相反的。
为了找到适合的阈值和过滤参数,我们通过二分法,以视觉和手动的方式进行。
higher_threshold = 125
dividing = image > higher_threshold

smoother_dividing = ski.filters.rank.mean(
    ski.util.img_as_ubyte(dividing), ski.morphology.disk(4)
)

binary_smoother_dividing = smoother_dividing > 20

fig, ax = plt.subplots(figsize=(5, 5))
ax.imshow(binary_smoother_dividing)
ax.set_title('Dividing nuclei')
ax.set_axis_off()
plt.show()
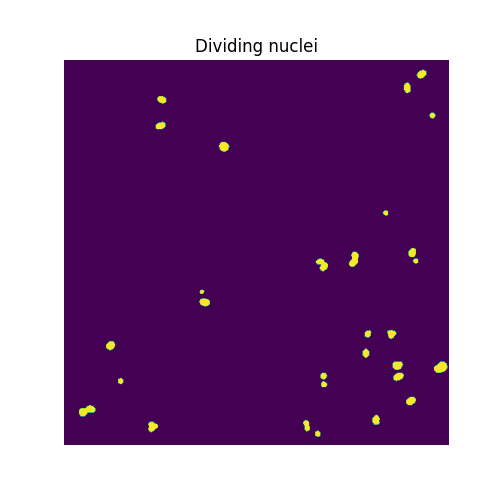
我们剩下的是
cleaned_dividing = ski.measure.label(binary_smoother_dividing)
print(cleaned_dividing.max())
29
在这个样本中分裂的核。
分割细胞核#
为了分离重叠的细胞核,我们采用 流域分割。该算法的思想是找到分水岭盆地,就像从一组 标记 开始泛滥一样。我们生成这些标记作为到背景的距离函数的局部最大值。鉴于细胞核的典型大小,我们传递 min_distance=7,以便局部最大值和标记至少相距7个像素。我们还使用 exclude_border=False,以便所有接触图像边界的细胞核都将被包括在内。
distance = ndi.distance_transform_edt(cells)

local_max_coords = ski.feature.peak_local_max(
    distance, min_distance=7, exclude_border=False
)
local_max_mask = np.zeros(distance.shape, dtype=bool)
local_max_mask[tuple(local_max_coords.T)] = True
markers = ski.measure.label(local_max_mask)

segmented_cells = ski.segmentation.watershed(-distance, markers, mask=cells)
为了方便地可视化分割结果,我们使用 color.label2rgb 函数对标记区域进行颜色编码,并通过参数 bg_label=0 指定背景标签。
fig, ax = plt.subplots(ncols=2, figsize=(10, 5))
ax[0].imshow(cells, cmap='gray')
ax[0].set_title('Overlapping nuclei')
ax[0].set_axis_off()
ax[1].imshow(ski.color.label2rgb(segmented_cells, bg_label=0))
ax[1].set_title('Segmented nuclei')
ax[1].set_axis_off()
plt.show()
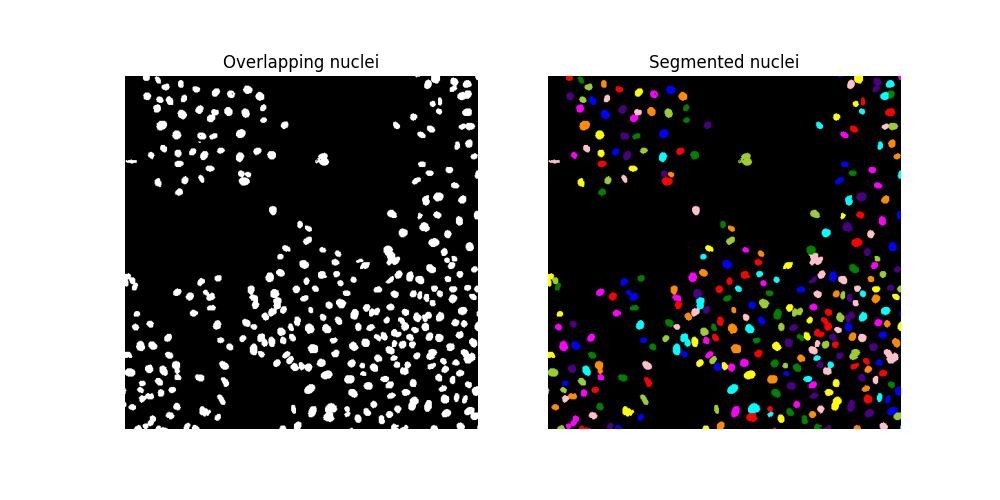
确保分水岭算法已导致识别出更多细胞核:
assert segmented_cells.max() > labeled_cells.max()
最后,我们找到一个总数为
print(segmented_cells.max())
317
在这个样本中的细胞。因此,我们估计有丝分裂指数为:
print(cleaned_dividing.max() / segmented_cells.max())
0.0914826498422713
脚本总运行时间: (0 分钟 0.538 秒)
