备注
前往结尾 下载完整示例代码。或在 Binder 上通过浏览器运行此示例。
共定位指标#
在这个例子中,我们展示了使用不同的指标来评估两个不同图像通道的共定位情况。
共定位可以分为两个不同的概念:1. 共现:一种物质在特定区域的比例是多少?2. 相关性:两种物质之间的强度关系是什么?
共现:亚细胞定位#
想象一下,我们正在尝试确定一种蛋白质的亚细胞定位——与对照组相比,它更多地位于细胞核还是细胞质中?
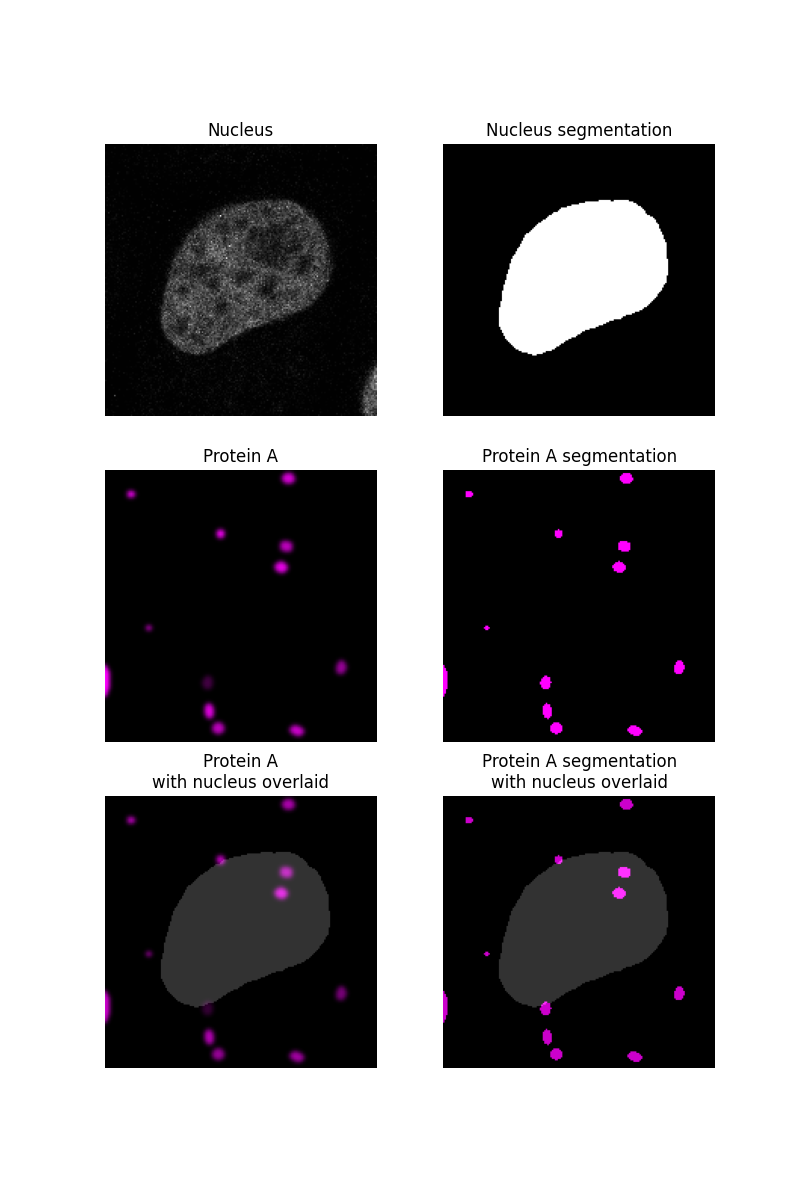
我们首先按照另一个 示例 中描述的方法对样本图像的细胞核进行分割,并假设细胞核外的部分为细胞质。蛋白质“蛋白质A”将被模拟为斑点并进行分割。
import matplotlib.pyplot as plt
import numpy as np
from matplotlib.colors import LinearSegmentedColormap
from scipy import ndimage as ndi
from skimage import data, filters, measure, segmentation

rng = np.random.default_rng()

# segment nucleus
nucleus = data.protein_transport()[0, 0, :, :180]
smooth = filters.gaussian(nucleus, sigma=1.5)
thresh = smooth > filters.threshold_otsu(smooth)
fill = ndi.binary_fill_holes(thresh)
nucleus_seg = segmentation.clear_border(fill)

# protein blobs of varying intensity
proteinA = np.zeros_like(nucleus, dtype="float64")
proteinA_seg = np.zeros_like(nucleus, dtype="float64")

for blob_seed in range(10):
    blobs = data.binary_blobs(
        180, blob_size_fraction=0.5, volume_fraction=(50 / (180**2)), rng=blob_seed
    )
    blobs_image = filters.gaussian(blobs, sigma=1.5) * rng.integers(50, 256)
    proteinA += blobs_image
    proteinA_seg += blobs

# plot data
fig, ax = plt.subplots(3, 2, figsize=(8, 12), sharey=True)
ax[0, 0].imshow(nucleus, cmap=plt.cm.gray)
ax[0, 0].set_title('Nucleus')

ax[0, 1].imshow(nucleus_seg, cmap=plt.cm.gray)
ax[0, 1].set_title('Nucleus segmentation')

black_magenta = LinearSegmentedColormap.from_list("", ["black", "magenta"])
ax[1, 0].imshow(proteinA, cmap=black_magenta)
ax[1, 0].set_title('Protein A')

ax[1, 1].imshow(proteinA_seg, cmap=black_magenta)
ax[1, 1].set_title('Protein A segmentation')

ax[2, 0].imshow(proteinA, cmap=black_magenta)
ax[2, 0].imshow(nucleus_seg, cmap=plt.cm.gray, alpha=0.2)
ax[2, 0].set_title('Protein A\nwith nucleus overlaid')

ax[2, 1].imshow(proteinA_seg, cmap=black_magenta)
ax[2, 1].imshow(nucleus_seg, cmap=plt.cm.gray, alpha=0.2)
ax[2, 1].set_title('Protein A segmentation\nwith nucleus overlaid')

for a in ax.ravel():
    a.set_axis_off()

交集系数#
在对核和感兴趣的蛋白质进行分割后,我们可以确定蛋白质A的分割与核分割重叠的部分。
0.22
Manders’ 共定位系数 (MCC)#
重叠系数假设蛋白质分割区域的面积对应于该蛋白质的浓度——面积越大表示蛋白质越多。由于图像的分辨率通常太小,无法分辨单个蛋白质,它们可能会聚集在一个像素内,使该像素的亮度增加。因此,为了更好地捕捉蛋白质浓度,我们可能会选择确定蛋白质通道的 强度 有多少比例位于细胞核内。这个指标被称为 Manders 共定位系数。
在这张图像中,虽然核内有许多蛋白质A的斑点,但它们比核外的某些斑点暗淡,因此MCC远低于重叠系数。
np.float64(0.23092970335972537)
在选择了一个共现度量后,我们可以将相同的过程应用于控制图像。如果没有控制图像可用,可以使用Costes方法将原始图像的MCC值与随机打乱图像的MCC值进行比较。关于这种方法的信息在[1]_中给出。
相关性:两种蛋白质的关联#
现在,想象一下我们想知道两个蛋白质之间的相关性有多密切。
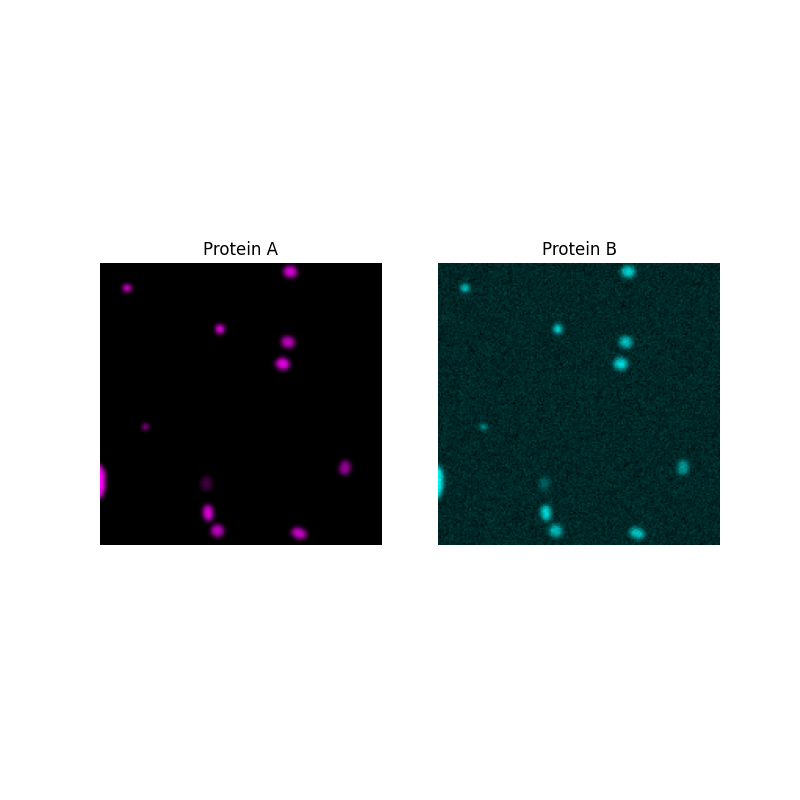
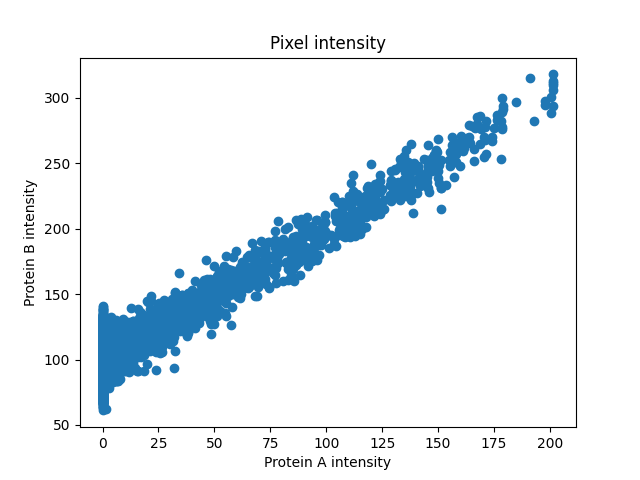
首先,我们将生成蛋白质B,并在每个像素中绘制两种蛋白质的强度,以观察它们之间的关系。
# generating protein B data that is correlated to protein A for demo
proteinB = proteinA + rng.normal(loc=100, scale=10, size=proteinA.shape)

# plot images
fig, ax = plt.subplots(1, 2, figsize=(8, 8), sharey=True)

ax[0].imshow(proteinA, cmap=black_magenta)
ax[0].set_title('Protein A')

black_cyan = LinearSegmentedColormap.from_list("", ["black", "cyan"])
ax[1].imshow(proteinB, cmap=black_cyan)
ax[1].set_title('Protein B')

for a in ax.ravel():
    a.set_axis_off()

# plot pixel intensity scatter
fig, ax = plt.subplots()
ax.scatter(proteinA, proteinB)
ax.set_title('Pixel intensity')
ax.set_xlabel('Protein A intensity')
ax.set_ylabel('Protein B intensity')
Text(38.347222222222214, 0.5, 'Protein B intensity')
强度看起来是线性相关的,因此皮尔逊相关系数可以给我们一个很好的衡量关联强度的指标。
PCC: 0.838, p-val: 0
有时强度是相关的,但不是线性方式。像 Spearman’s 这样的基于秩的相关系数在这种情况下可能会提供更准确的非线性关系度量。
plt.show()
脚本总运行时间: (0 分钟 1.904 秒)


