备注
前往结尾 下载完整示例代码。或在 Binder 上通过浏览器运行此示例。
巴特沃斯滤波器#
巴特沃斯滤波器在频域中实现,设计为无通带或阻带波纹。它可以用于低通或高通变体。cutoff_frequency_ratio 参数用于将截止频率设置为采样频率的一部分。鉴于奈奎斯特频率是采样频率的一半,这意味着此参数应为小于0.5的正浮点值。滤波器的 order 可以调整以控制过渡宽度,值越高,通带和阻带之间的过渡越尖锐。
巴特沃斯滤波器示例#
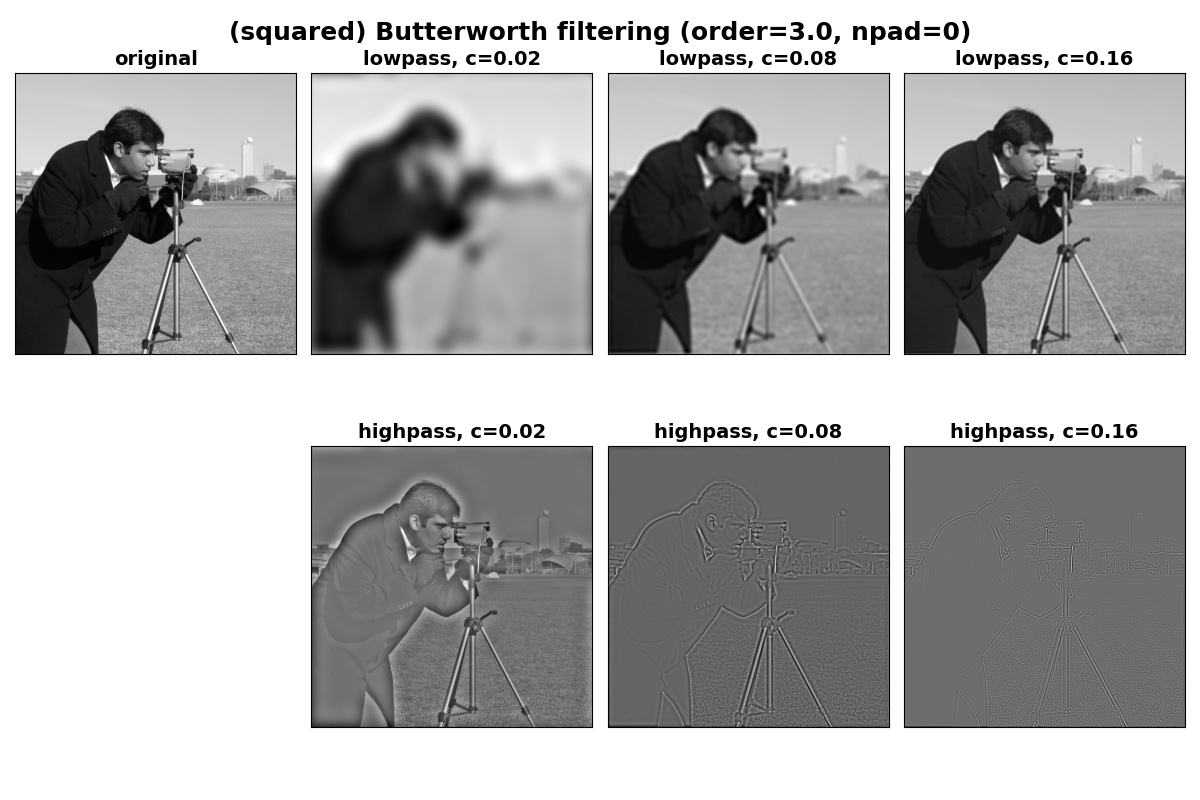
在这里,我们定义了一个 get_filtered 辅助函数,用于在指定的一系列截止频率上重复进行低通和高通滤波。
import matplotlib.pyplot as plt

from skimage import data, filters

image = data.camera()

# cutoff frequencies as a fraction of the maximum frequency
cutoffs = [0.02, 0.08, 0.16]


def get_filtered(image, cutoffs, squared_butterworth=True, order=3.0, npad=0):
    """Lowpass and highpass butterworth filtering at all specified cutoffs.

    Parameters
    ----------
    image : ndarray
        The image to be filtered.
    cutoffs : sequence of int
        Both lowpass and highpass filtering will be performed for each cutoff
        frequency in `cutoffs`.
    squared_butterworth : bool, optional
        Whether the traditional Butterworth filter or its square is used.
    order : float, optional
        The order of the Butterworth filter

    Returns
    -------
    lowpass_filtered : list of ndarray
        List of images lowpass filtered at the frequencies in `cutoffs`.
    highpass_filtered : list of ndarray
        List of images highpass filtered at the frequencies in `cutoffs`.
    """

    lowpass_filtered = []
    highpass_filtered = []
    for cutoff in cutoffs:
        lowpass_filtered.append(
            filters.butterworth(
                image,
                cutoff_frequency_ratio=cutoff,
                order=order,
                high_pass=False,
                squared_butterworth=squared_butterworth,
                npad=npad,
            )
        )
        highpass_filtered.append(
            filters.butterworth(
                image,
                cutoff_frequency_ratio=cutoff,
                order=order,
                high_pass=True,
                squared_butterworth=squared_butterworth,
                npad=npad,
            )
        )
    return lowpass_filtered, highpass_filtered


def plot_filtered(lowpass_filtered, highpass_filtered, cutoffs):
    """Generate plots for paired lists of lowpass and highpass images."""
    fig, axes = plt.subplots(2, 1 + len(cutoffs), figsize=(12, 8))
    fontdict = dict(fontsize=14, fontweight='bold')

    axes[0, 0].imshow(image, cmap='gray')
    axes[0, 0].set_title('original', fontdict=fontdict)
    axes[1, 0].set_axis_off()

    for i, c in enumerate(cutoffs):
        axes[0, i + 1].imshow(lowpass_filtered[i], cmap='gray')
        axes[0, i + 1].set_title(f'lowpass, c={c}', fontdict=fontdict)
        axes[1, i + 1].imshow(highpass_filtered[i], cmap='gray')
        axes[1, i + 1].set_title(f'highpass, c={c}', fontdict=fontdict)

    for ax in axes.ravel():
        ax.set_xticks([])
        ax.set_yticks([])
    plt.tight_layout()
    return fig, axes


# Perform filtering with the (squared) Butterworth filter at a range of
# cutoffs.
lowpasses, highpasses = get_filtered(image, cutoffs, squared_butterworth=True)

fig, axes = plot_filtered(lowpasses, highpasses, cutoffs)
titledict = dict(fontsize=18, fontweight='bold')
fig.text(
    0.5,
    0.95,
    '(squared) Butterworth filtering (order=3.0, npad=0)',
    fontdict=titledict,
    horizontalalignment='center',
)

Text(0.5, 0.95, '(squared) Butterworth filtering (order=3.0, npad=0)')
避免边界伪影#
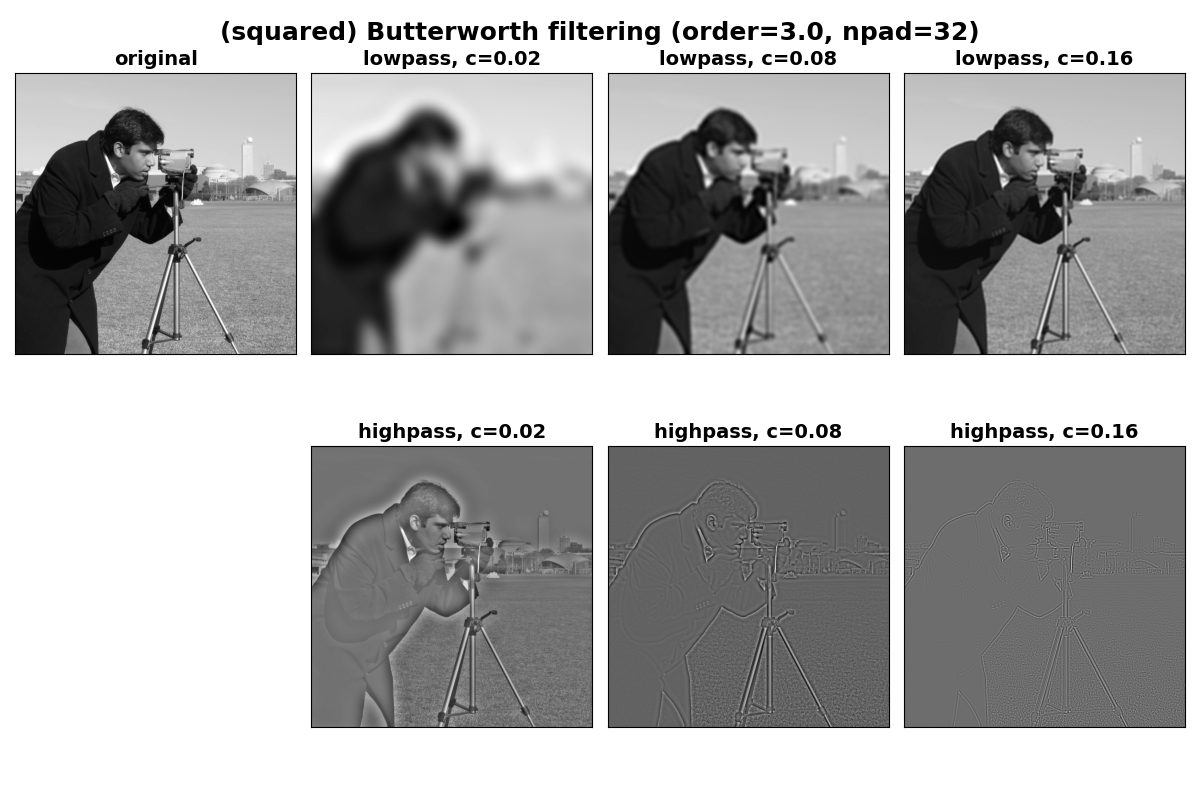
从上图可以看出,图像边缘附近存在伪影(特别是对于较小的截止值)。这是由于DFT的周期性特性造成的,可以通过在过滤之前对边缘应用一定量的填充来减少,以确保图像的周期性扩展中没有锐利的边缘。这可以通过 butterworth 的 npad 参数来实现。
请注意,通过填充,图像边缘不希望出现的阴影显著减少。

Text(0.5, 0.95, '(squared) Butterworth filtering (order=3.0, npad=32)')
真正的巴特沃斯滤波器#
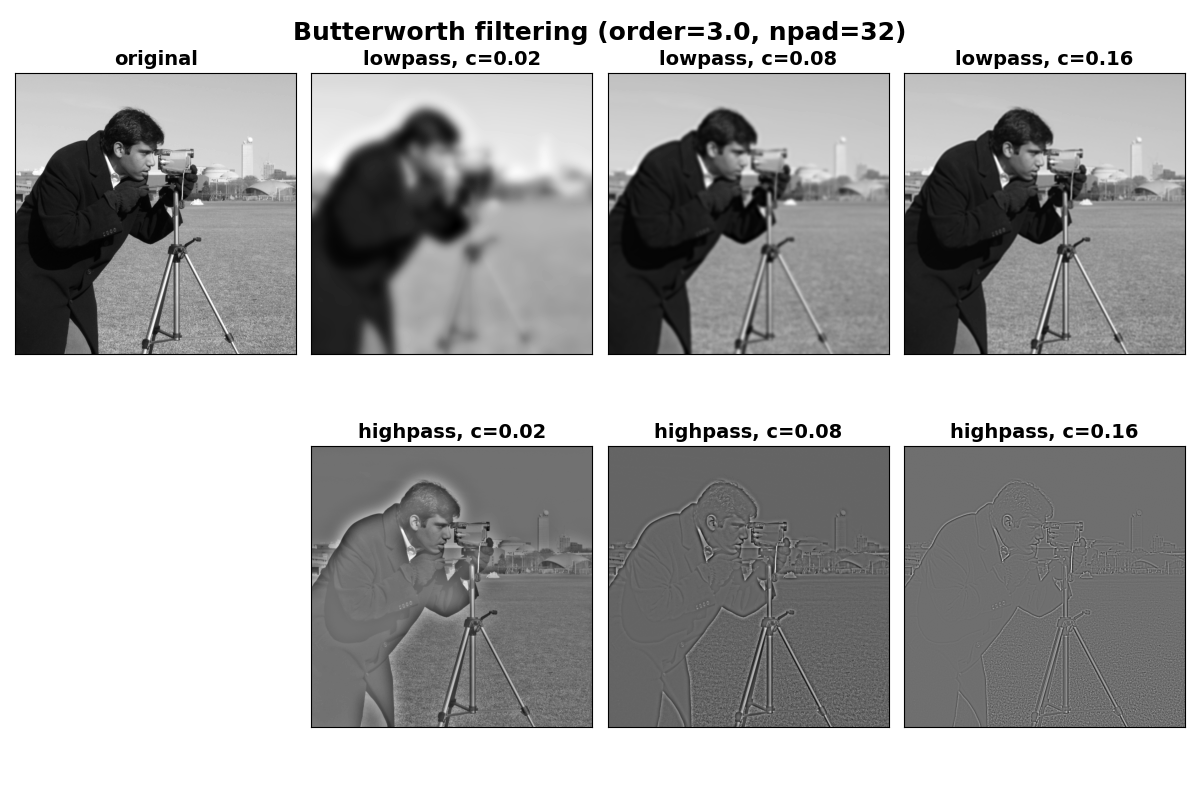
要使用传统的巴特沃斯滤波器定义,请设置 squared_butterworth=False。这种变体在频域中的幅度响应是默认情况下的平方根。这导致在任何给定的 阶数 下,从通带到阻带的过渡更加平缓。这在以下图像中可以看到,与上述平方巴特沃斯滤波器相比,低通情况下的图像略显锐利。

脚本总运行时间: (0 分钟 0.988 秒)
