备注
转到末尾 下载完整示例代码。或在 Binder 中通过浏览器运行此示例。
用于纹理分类的多块局部二值模式#
本示例展示了如何计算多块局部二值模式(MB-LBP)特征,以及如何可视化这些特征。
这些特征的计算方式类似于局部二值模式(LBPs),不同之处在于使用了求和块而非单个像素值。
MB-LBP 是 LBP 的一种扩展,它可以在恒定时间内使用积分图像在多个尺度上进行计算。使用 9 个等大小的矩形来计算特征。对于每个矩形,计算像素强度的总和。这些总和与中心矩形的总和的比较决定了特征,类似于 LBP(参见 LBP)。
首先,我们生成一张图像来说明MB-LBP的工作原理:考虑一个(9, 9)的矩形,并将其划分为(3, 3)的块,然后我们在这些块上应用MB-LBP。
from skimage.feature import multiblock_lbp
import numpy as np
from numpy.testing import assert_equal
from skimage.transform import integral_image

# Create test matrix where first and fifth rectangles starting
# from top left clockwise have greater value than the central one.
test_img = np.zeros((9, 9), dtype='uint8')
test_img[3:6, 3:6] = 1
test_img[:3, :3] = 50
test_img[6:, 6:] = 50

# First and fifth bits should be filled. This correct value will
#  be compared to the computed one.
correct_answer = 0b10001000

int_img = integral_image(test_img)

lbp_code = multiblock_lbp(int_img, 0, 0, 3, 3)

assert_equal(correct_answer, lbp_code)
现在让我们将该操作符应用于一张真实图像,看看可视化效果如何。
from skimage import data
from matplotlib import pyplot as plt
from skimage.feature import draw_multiblock_lbp

test_img = data.coins()

int_img = integral_image(test_img)

lbp_code = multiblock_lbp(int_img, 0, 0, 90, 90)

img = draw_multiblock_lbp(test_img, 0, 0, 90, 90, lbp_code=lbp_code, alpha=0.5)


plt.imshow(img)

plt.show()
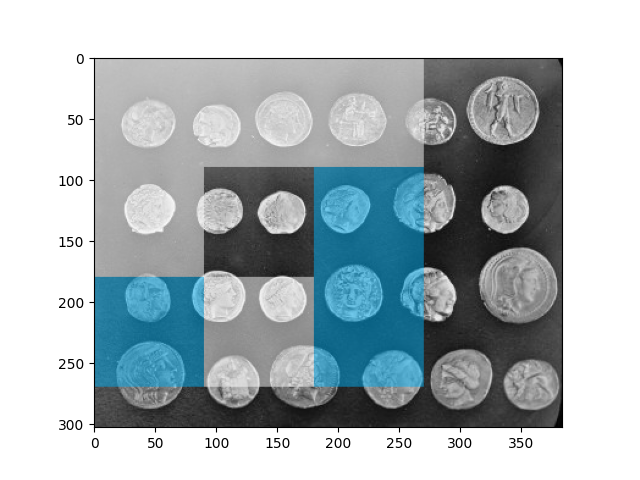
在上面的图中,我们看到了计算MB-LBP及其计算特征的可视化结果。强度和小于中心矩形的矩形用青色标记。强度值较高的矩形用白色标记。中心矩形保持不变。
脚本总运行时间: (0 分钟 0.094 秒)