备注
前往结尾 下载完整的示例代码。或者通过 Binder 在浏览器中运行此示例。
使用极坐标和极对数变换进行配准#
相位相关(registration.phase_cross_correlation)是一种用于确定相似图像对之间平移偏移的高效方法。然而,这种方法依赖于图像之间几乎没有旋转/缩放差异,这在现实世界的例子中是典型的。
为了恢复两幅图像之间的旋转和缩放差异,我们可以利用对数极坐标变换的两个几何特性和频域的平移不变性。首先,笛卡尔空间中的旋转在对数极坐标空间中变为沿角度坐标(\(\theta\))轴的平移。其次,笛卡尔空间中的缩放在对数极坐标空间中变为沿径向坐标(\(\rho = \ln\sqrt{x^2 + y^2}\))的平移。最后,空间域中的平移差异不会影响频域中的幅度谱。
在这一系列的示例中,我们基于这些概念来展示如何将对数极坐标变换 transform.warp_polar 与相位相关结合使用,以恢复两幅图像之间的旋转和缩放差异,这些图像还具有平移偏移。
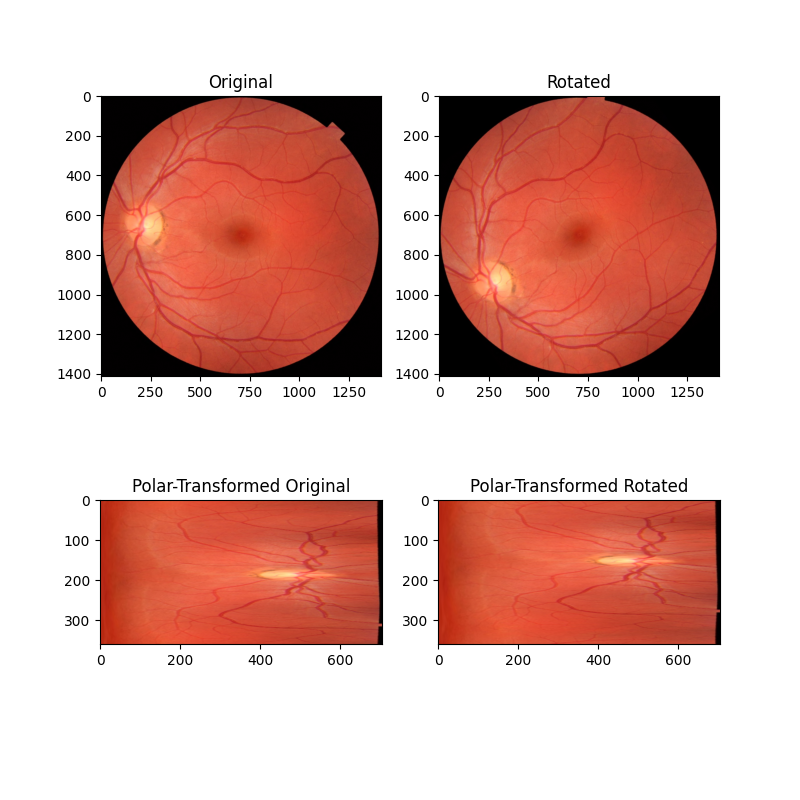
使用极坐标变换恢复旋转差异#
在这个第一个例子中,我们考虑两个图像的简单情况,它们仅在围绕共同中心点的旋转上有所不同。通过将这些图像重新映射到极坐标空间,旋转差异变成了可以通过相位相关恢复的简单平移差异。
import numpy as np
import matplotlib.pyplot as plt

from skimage import data
from skimage.registration import phase_cross_correlation
from skimage.transform import warp_polar, rotate, rescale
from skimage.util import img_as_float

radius = 705
angle = 35
image = data.retina()
image = img_as_float(image)
rotated = rotate(image, angle)
image_polar = warp_polar(image, radius=radius, channel_axis=-1)
rotated_polar = warp_polar(rotated, radius=radius, channel_axis=-1)

fig, axes = plt.subplots(2, 2, figsize=(8, 8))
ax = axes.ravel()
ax[0].set_title("Original")
ax[0].imshow(image)
ax[1].set_title("Rotated")
ax[1].imshow(rotated)
ax[2].set_title("Polar-Transformed Original")
ax[2].imshow(image_polar)
ax[3].set_title("Polar-Transformed Rotated")
ax[3].imshow(rotated_polar)
plt.show()

shifts, error, phasediff = phase_cross_correlation(
    image_polar, rotated_polar, normalization=None
)
print(f'Expected value for counterclockwise rotation in degrees: ' f'{angle}')
print(f'Recovered value for counterclockwise rotation: ' f'{shifts[0]}')

Expected value for counterclockwise rotation in degrees: 35
Recovered value for counterclockwise rotation: 35.0
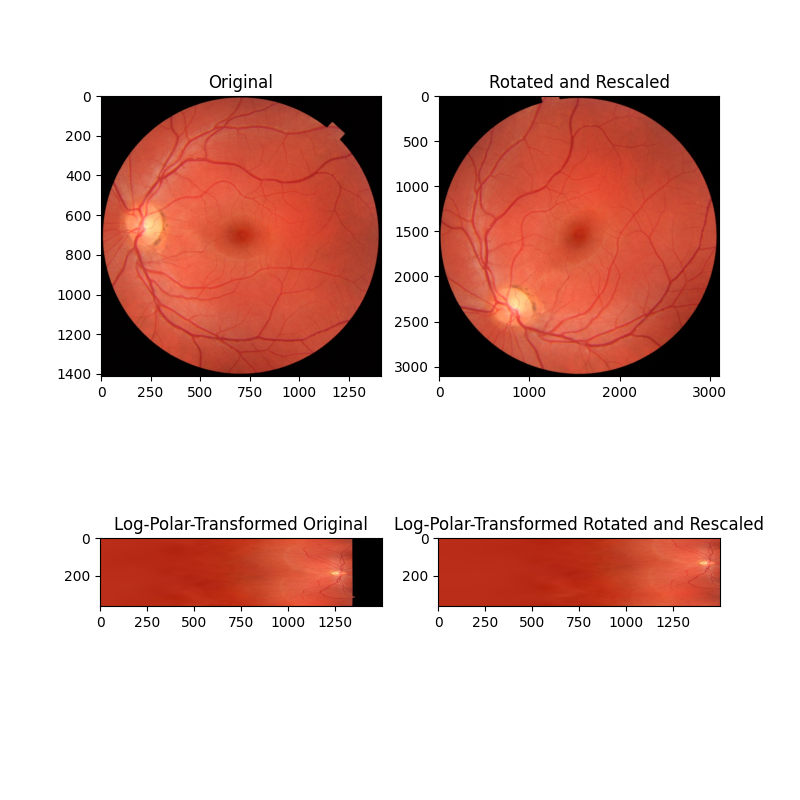
使用对数极坐标变换恢复旋转和缩放差异#
在这个第二个例子中,图像在旋转和缩放上有所不同(注意轴刻度值)。通过将这些图像重新映射到对数极坐标空间,我们可以像以前一样恢复旋转,现在还可以通过相位相关来恢复缩放。
# radius must be large enough to capture useful info in larger image
radius = 1500
angle = 53.7
scale = 2.2
image = data.retina()
image = img_as_float(image)
rotated = rotate(image, angle)
rescaled = rescale(rotated, scale, channel_axis=-1)
image_polar = warp_polar(image, radius=radius, scaling='log', channel_axis=-1)
rescaled_polar = warp_polar(rescaled, radius=radius, scaling='log', channel_axis=-1)

fig, axes = plt.subplots(2, 2, figsize=(8, 8))
ax = axes.ravel()
ax[0].set_title("Original")
ax[0].imshow(image)
ax[1].set_title("Rotated and Rescaled")
ax[1].imshow(rescaled)
ax[2].set_title("Log-Polar-Transformed Original")
ax[2].imshow(image_polar)
ax[3].set_title("Log-Polar-Transformed Rotated and Rescaled")
ax[3].imshow(rescaled_polar)
plt.show()

# setting `upsample_factor` can increase precision
shifts, error, phasediff = phase_cross_correlation(
    image_polar, rescaled_polar, upsample_factor=20, normalization=None
)
shiftr, shiftc = shifts[:2]

# Calculate scale factor from translation
klog = radius / np.log(radius)
shift_scale = 1 / (np.exp(shiftc / klog))

print(f'Expected value for cc rotation in degrees: {angle}')
print(f'Recovered value for cc rotation: {shiftr}')
print()
print(f'Expected value for scaling difference: {scale}')
print(f'Recovered value for scaling difference: {shift_scale}')

Expected value for cc rotation in degrees: 53.7
Recovered value for cc rotation: 53.75

Expected value for scaling difference: 2.2
Recovered value for scaling difference: 2.1981889915232165
在已翻译的图像上进行旋转和缩放 - 第1部分#
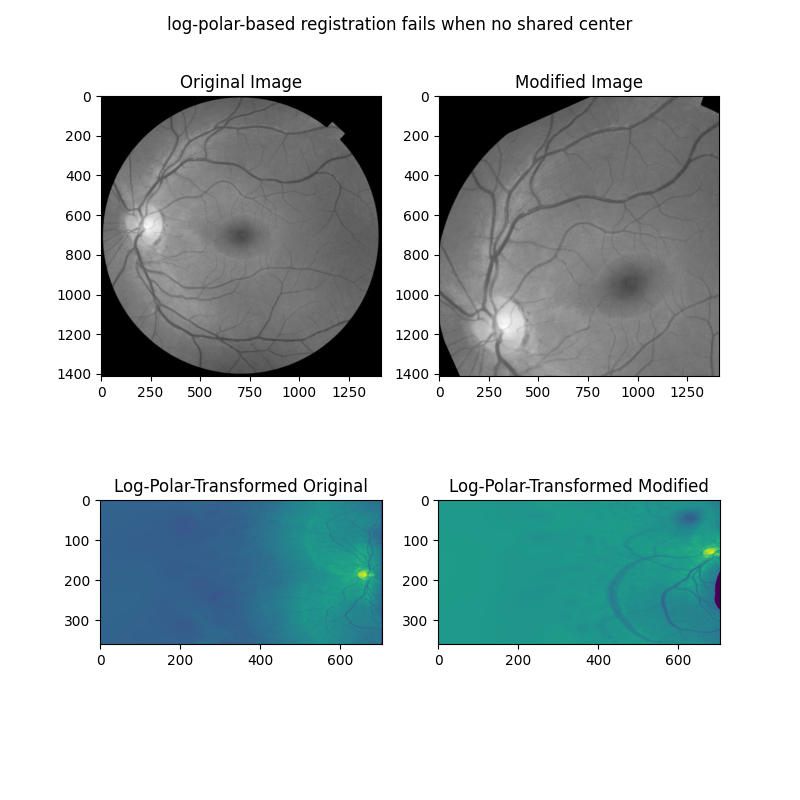
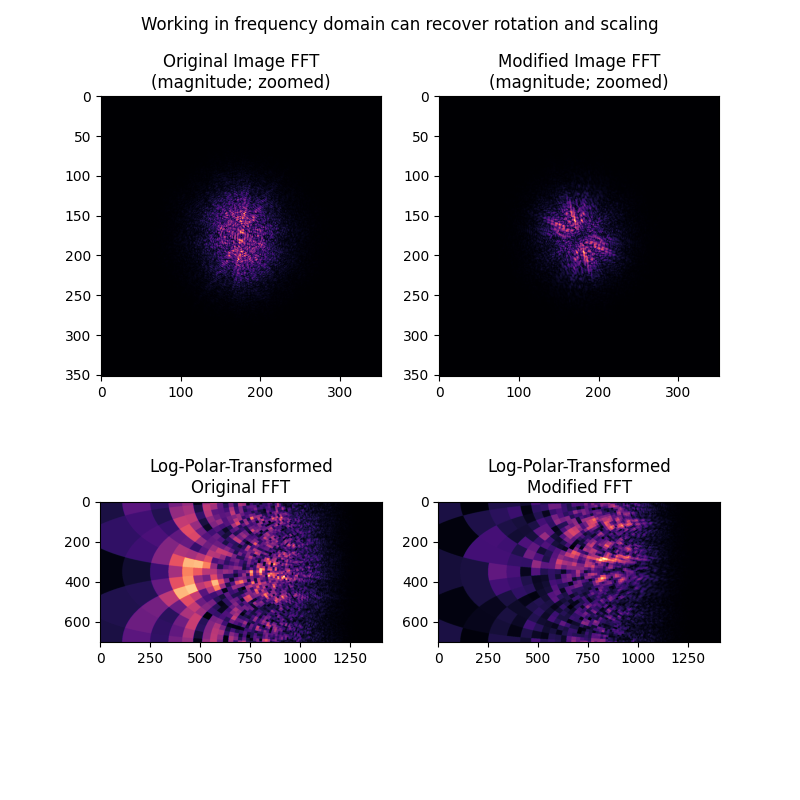
上述示例仅在待注册的图像共享一个中心时有效。然而,更常见的情况是,待注册的两幅图像之间还存在一个平移分量。一种注册旋转、缩放和平移的方法是首先校正旋转和缩放,然后求解平移。通过处理傅里叶变换图像的幅度谱,可以解析平移图像的旋转和缩放差异。
在下一个示例中,我们首先展示当两张图像因旋转、缩放和位移而有所不同时,上述方法是如何失败的。
from skimage.color import rgb2gray
from skimage.filters import window, difference_of_gaussians
from scipy.fft import fft2, fftshift

angle = 24
scale = 1.4
shiftr = 30
shiftc = 15

image = rgb2gray(data.retina())
translated = image[shiftr:, shiftc:]
rotated = rotate(translated, angle)
rescaled = rescale(rotated, scale)
sizer, sizec = image.shape
rts_image = rescaled[:sizer, :sizec]

# When center is not shared, log-polar transform is not helpful!
radius = 705
warped_image = warp_polar(image, radius=radius, scaling="log")
warped_rts = warp_polar(rts_image, radius=radius, scaling="log")
shifts, error, phasediff = phase_cross_correlation(
    warped_image, warped_rts, upsample_factor=20, normalization=None
)
shiftr, shiftc = shifts[:2]
klog = radius / np.log(radius)
shift_scale = 1 / (np.exp(shiftc / klog))

fig, axes = plt.subplots(2, 2, figsize=(8, 8))
ax = axes.ravel()
ax[0].set_title("Original Image")
ax[0].imshow(image, cmap='gray')
ax[1].set_title("Modified Image")
ax[1].imshow(rts_image, cmap='gray')
ax[2].set_title("Log-Polar-Transformed Original")
ax[2].imshow(warped_image)
ax[3].set_title("Log-Polar-Transformed Modified")
ax[3].imshow(warped_rts)
fig.suptitle('log-polar-based registration fails when no shared center')
plt.show()

print(f'Expected value for cc rotation in degrees: {angle}')
print(f'Recovered value for cc rotation: {shiftr}')
print()
print(f'Expected value for scaling difference: {scale}')
print(f'Recovered value for scaling difference: {shift_scale}')

Expected value for cc rotation in degrees: 24
Recovered value for cc rotation: -167.55

Expected value for scaling difference: 1.4
Recovered value for scaling difference: 25.110458986143573
在已翻译的图像上注册旋转和缩放 - 第二部分#
接下来,我们将展示图像的频率幅度谱中如何明显地显示出旋转和缩放差异,而不是平移差异。通过将幅度谱视为图像本身,并应用上述相同的对数极坐标+相位相关方法,可以恢复这些差异。
# First, band-pass filter both images
image = difference_of_gaussians(image, 5, 20)
rts_image = difference_of_gaussians(rts_image, 5, 20)

# window images
wimage = image * window('hann', image.shape)
rts_wimage = rts_image * window('hann', image.shape)

# work with shifted FFT magnitudes
image_fs = np.abs(fftshift(fft2(wimage)))
rts_fs = np.abs(fftshift(fft2(rts_wimage)))

# Create log-polar transformed FFT mag images and register
shape = image_fs.shape
radius = shape[0] // 8  # only take lower frequencies
warped_image_fs = warp_polar(
    image_fs, radius=radius, output_shape=shape, scaling='log', order=0
)
warped_rts_fs = warp_polar(
    rts_fs, radius=radius, output_shape=shape, scaling='log', order=0
)

warped_image_fs = warped_image_fs[: shape[0] // 2, :]  # only use half of FFT
warped_rts_fs = warped_rts_fs[: shape[0] // 2, :]
shifts, error, phasediff = phase_cross_correlation(
    warped_image_fs, warped_rts_fs, upsample_factor=10, normalization=None
)

# Use translation parameters to calculate rotation and scaling parameters
shiftr, shiftc = shifts[:2]
recovered_angle = (360 / shape[0]) * shiftr
klog = shape[1] / np.log(radius)
shift_scale = np.exp(shiftc / klog)

fig, axes = plt.subplots(2, 2, figsize=(8, 8))
ax = axes.ravel()
ax[0].set_title("Original Image FFT\n(magnitude; zoomed)")
center = np.array(shape) // 2
ax[0].imshow(
    image_fs[
        center[0] - radius : center[0] + radius, center[1] - radius : center[1] + radius
    ],
    cmap='magma',
)
ax[1].set_title("Modified Image FFT\n(magnitude; zoomed)")
ax[1].imshow(
    rts_fs[
        center[0] - radius : center[0] + radius, center[1] - radius : center[1] + radius
    ],
    cmap='magma',
)
ax[2].set_title("Log-Polar-Transformed\nOriginal FFT")
ax[2].imshow(warped_image_fs, cmap='magma')
ax[3].set_title("Log-Polar-Transformed\nModified FFT")
ax[3].imshow(warped_rts_fs, cmap='magma')
fig.suptitle('Working in frequency domain can recover rotation and scaling')
plt.show()

print(f'Expected value for cc rotation in degrees: {angle}')
print(f'Recovered value for cc rotation: {recovered_angle}')
print()
print(f'Expected value for scaling difference: {scale}')
print(f'Recovered value for scaling difference: {shift_scale}')

Expected value for cc rotation in degrees: 24
Recovered value for cc rotation: 23.753366406803682

Expected value for scaling difference: 1.4
Recovered value for scaling difference: 1.3901762721757436
关于这种方法的一些说明#
需要注意的是,这种方法依赖于几个必须提前选择的参数,而这些参数并没有明确的优化选择:
1. The images should have some degree of bandpass filtering applied, particularly to remove high frequencies, and different choices here may impact outcome. The bandpass filter also complicates matters because, since the images to be registered will differ in scale and these scale differences are unknown, any bandpass filter will necessarily attenuate different features between the images. For example, the log-polar transformed magnitude spectra don’t really look “alike” in the last example here. Yet if you look closely, there are some common patterns in those spectra, and they do end up aligning well by phase correlation as demonstrated.
2. Images must be windowed using windows with circular symmetry, to remove the spectral leakage coming from image borders. There is no clearly optimal choice of window.
最后,我们注意到尺度的巨大变化将显著改变幅度谱,特别是由于尺度的巨大变化通常伴随着一些裁剪和信息内容的损失。文献建议保持在1.8-2倍的尺度变化范围内 [1] [2]。这对于大多数生物成像应用来说是合适的。
参考文献#
脚本总运行时间: (0 分钟 4.768 秒)
