备注
前往结尾 下载完整示例代码。或者通过 Binder 在浏览器中运行此示例。
滞后阈值#
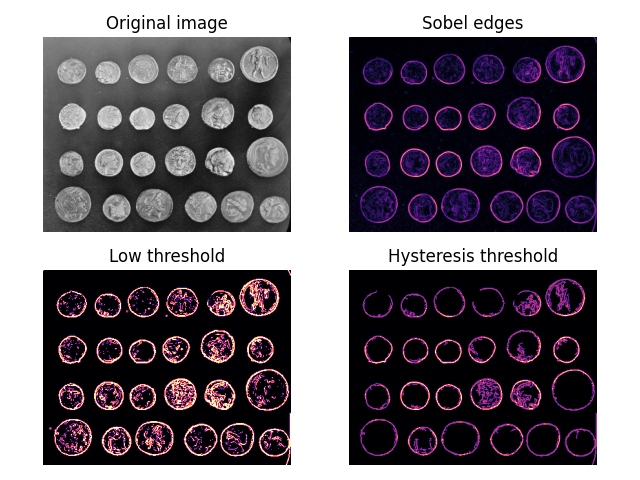
Hysteresis 是效应的滞后——一种惯性。在阈值处理的上下文中,这意味着如果某些高于 低 阈值的区域也与高于更高、更严格的阈值的区域相连,则这些区域被认为是高于阈值的。因此,它们可以被视为这些高置信度区域的延续。
下面,我们将普通阈值处理与滞后阈值处理进行比较。注意滞后处理如何允许我们忽略硬币边缘外的“噪声”。
import matplotlib.pyplot as plt
from skimage import data, filters

fig, ax = plt.subplots(nrows=2, ncols=2)

image = data.coins()
edges = filters.sobel(image)

low = 0.1
high = 0.35

lowt = (edges > low).astype(int)
hight = (edges > high).astype(int)
hyst = filters.apply_hysteresis_threshold(edges, low, high)

ax[0, 0].imshow(image, cmap='gray')
ax[0, 0].set_title('Original image')

ax[0, 1].imshow(edges, cmap='magma')
ax[0, 1].set_title('Sobel edges')

ax[1, 0].imshow(lowt, cmap='magma')
ax[1, 0].set_title('Low threshold')

ax[1, 1].imshow(hight + hyst, cmap='magma')
ax[1, 1].set_title('Hysteresis threshold')

for a in ax.ravel():
    a.axis('off')

plt.tight_layout()

plt.show()
脚本的总运行时间: (0 分钟 0.174 秒)