备注
转到末尾 以下载完整示例代码。或在浏览器中通过 Binder 运行此示例。
在核膜处测量荧光强度#
此示例再现了生物图像数据分析中一个成熟的流程,用于测量核膜定位的荧光强度,在细胞图像的时间序列中(每个图像有两个通道和两个空间维度),显示了蛋白质从细胞质区域重新定位到核膜的过程。这一生物应用首先由Andrea Boni及其合作者在[1]_中提出;它被Kota Miura在[2]_的教科书中使用,以及其他作品中([3],[4])。换句话说,我们将此工作流程从ImageJ宏移植到Python,使用scikit-image。
import matplotlib.pyplot as plt
import numpy as np
import plotly.io
import plotly.express as px
from scipy import ndimage as ndi

from skimage import filters, measure, morphology, segmentation
from skimage.data import protein_transport
我们从单个细胞/细胞核开始构建工作流程。
image_sequence = protein_transport()

print(f'shape: {image_sequence.shape}')
shape: (15, 2, 180, 183)
该数据集是一个包含15帧(时间点)和2个通道的2D图像堆栈。
vmin, vmax = 0, image_sequence.max()

fig = px.imshow(
    image_sequence,
    facet_col=1,
    animation_frame=0,
    zmin=vmin,
    zmax=vmax,
    binary_string=True,
    labels={'animation_frame': 'time point', 'facet_col': 'channel'},
)
plotly.io.show(fig)
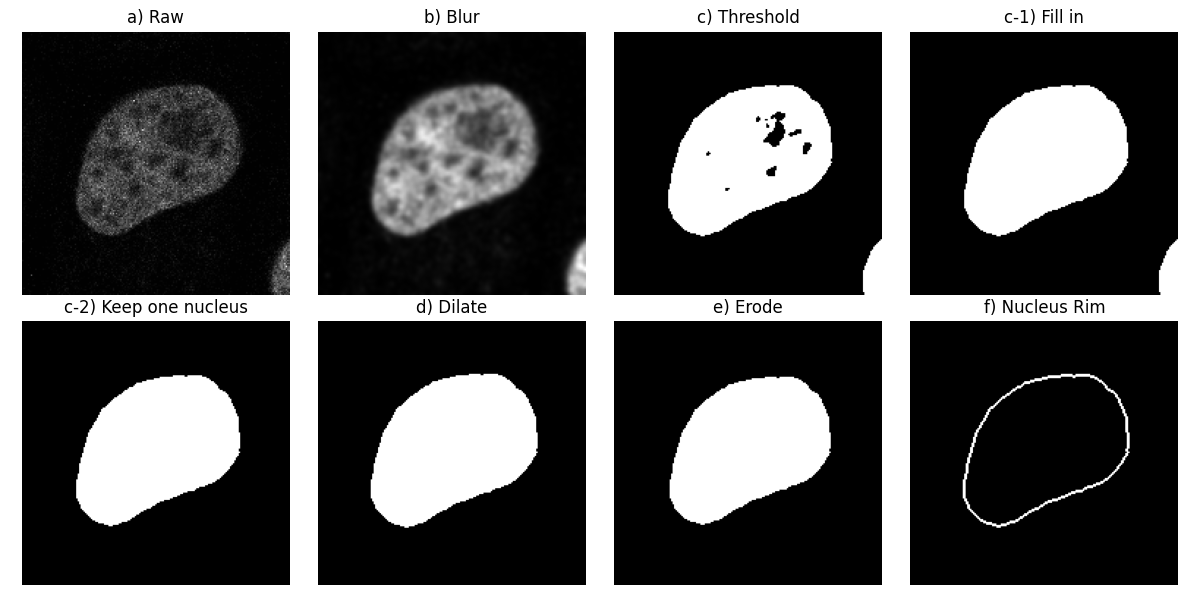
首先,让我们考虑第一张图像的第一个通道(如图中步骤 a) 所示)。
image_t_0_channel_0 = image_sequence[0, 0, :, :]
分割细胞核边缘#
让我们对这个图像应用一个高斯低通滤波器以使其平滑(步骤 b))。接下来,我们分割细胞核,使用Otsu方法找到背景和前景之间的阈值:我们得到一个二值图像(步骤 c))。然后我们填充对象中的孔洞(步骤 c-1))。
smooth = filters.gaussian(image_t_0_channel_0, sigma=1.5)

thresh_value = filters.threshold_otsu(smooth)
thresh = smooth > thresh_value

fill = ndi.binary_fill_holes(thresh)
按照原始工作流程,让我们移除接触图像边缘的对象(步骤 c-2))。在这里,我们可以看到另一部分核接触到了右下角。
dtype('bool')
我们计算了此二值图像的形态学膨胀(步骤 d))及其形态学腐蚀(步骤 e))。
最后,我们从膨胀后的图像中减去腐蚀后的图像,以得到核的边缘(步骤 f))。这相当于选择那些在 dilate 中存在,但在 erode 中不存在的像素:
mask = np.logical_and(dilate, ~erode)
让我们在一系列的子图中可视化这些处理步骤。
fig, ax = plt.subplots(2, 4, figsize=(12, 6), sharey=True)

ax[0, 0].imshow(image_t_0_channel_0, cmap=plt.cm.gray)
ax[0, 0].set_title('a) Raw')

ax[0, 1].imshow(smooth, cmap=plt.cm.gray)
ax[0, 1].set_title('b) Blur')

ax[0, 2].imshow(thresh, cmap=plt.cm.gray)
ax[0, 2].set_title('c) Threshold')

ax[0, 3].imshow(fill, cmap=plt.cm.gray)
ax[0, 3].set_title('c-1) Fill in')

ax[1, 0].imshow(clear, cmap=plt.cm.gray)
ax[1, 0].set_title('c-2) Keep one nucleus')

ax[1, 1].imshow(dilate, cmap=plt.cm.gray)
ax[1, 1].set_title('d) Dilate')

ax[1, 2].imshow(erode, cmap=plt.cm.gray)
ax[1, 2].set_title('e) Erode')

ax[1, 3].imshow(mask, cmap=plt.cm.gray)
ax[1, 3].set_title('f) Nucleus Rim')

for a in ax.ravel():
    a.set_axis_off()

fig.tight_layout()

应用分段轮辋作为遮罩#
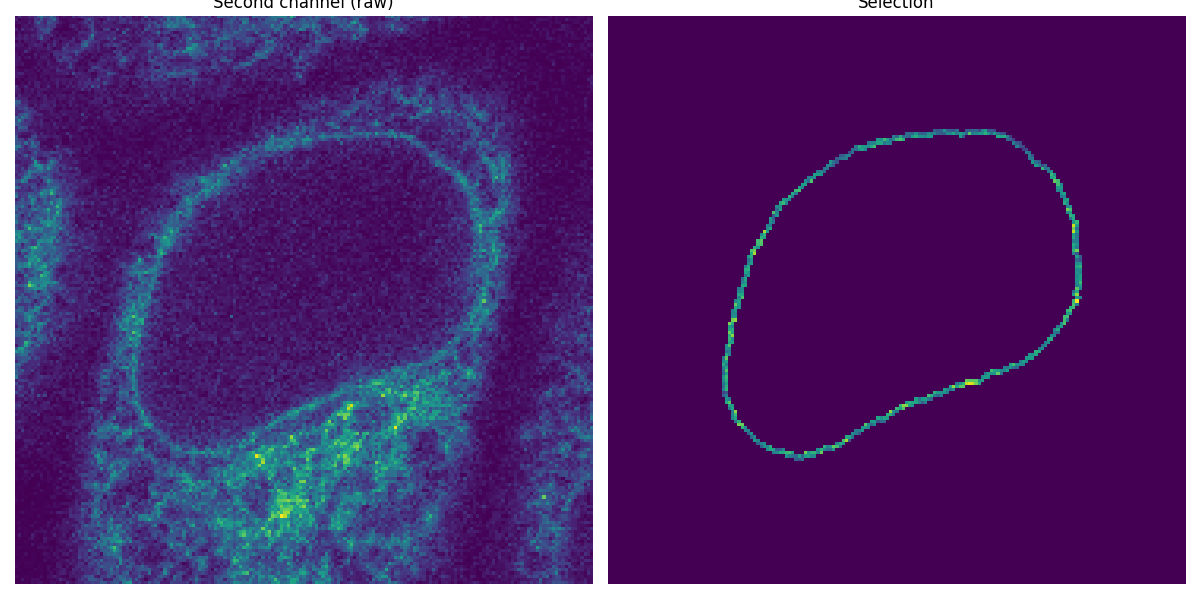
既然我们已经将核膜在第一个通道中分割出来,我们将其用作掩膜来测量第二个通道中的强度。
image_t_0_channel_1 = image_sequence[0, 1, :, :]
selection = np.where(mask, image_t_0_channel_1, 0)

fig, (ax0, ax1) = plt.subplots(1, 2, figsize=(12, 6), sharey=True)

ax0.imshow(image_t_0_channel_1)
ax0.set_title('Second channel (raw)')
ax0.set_axis_off()

ax1.imshow(selection)
ax1.set_title('Selection')
ax1.set_axis_off()

fig.tight_layout()

测量总强度#
平均强度在标记图像中作为区域属性很容易获得。
props = measure.regionprops_table(
    mask.astype(np.uint8),
    intensity_image=image_t_0_channel_1,
    properties=('label', 'area', 'intensity_mean'),
)
我们可能需要检查总强度的值
selection.sum()
np.uint64(28350)
可以从以下位置恢复:
array([28350.])
处理整个图像序列#
我们不是每次时间点都迭代工作流程,而是直接处理多维数据集(除了阈值处理步骤)。实际上,大多数 scikit-image 函数都支持 nD 图像。
n_z = image_sequence.shape[0]  # number of frames

smooth_seq = filters.gaussian(image_sequence[:, 0, :, :], sigma=(0, 1.5, 1.5))
thresh_values = [filters.threshold_otsu(s) for s in smooth_seq[:]]
thresh_seq = [smooth_seq[k, ...] > val for k, val in enumerate(thresh_values)]
或者,我们可以通过将 smooth_seq 重塑为二维(其中第一维仍然对应于时间点,但第二维和最后一维现在包含所有像素值),并在图像序列的第二轴上应用阈值函数,来计算 thresh_values,而不使用列表推导。
thresh_values = np.apply_along_axis(filters.threshold_otsu,
                                    axis=1,
                                    arr=smooth_seq.reshape(n_z, -1))
我们使用以下扁平结构元素进行形态学计算(np.newaxis 用于在时间上预置一个大小为1的轴):
footprint = ndi.generate_binary_structure(2, 1)[np.newaxis, ...]
footprint
array([[[False,  True, False],
        [ True,  True,  True],
        [False,  True, False]]])
通过这种方式,每个帧都是独立处理的(连续帧中的像素永远不会是空间邻居)。
fill_seq = ndi.binary_fill_holes(thresh_seq, structure=footprint)
在清除接触图像边界的对象时,我们希望确保底部(第一帧)和顶部(最后一帧)不被视为边界。在这种情况下,唯一相关的边界是位于最大(x,y)值处的边缘。通过运行以下代码可以在3D中看到这一点:
border_mask = np.ones_like(fill_seq)
border_mask[n_z // 2, -1, -1] = False
clear_seq = segmentation.clear_border(fill_seq, mask=border_mask)

dilate_seq = morphology.binary_dilation(clear_seq, footprint=footprint)
erode_seq = morphology.binary_erosion(clear_seq, footprint=footprint)
mask_sequence = np.logical_and(dilate_seq, ~erode_seq)
让我们为每个掩码(对应于每个时间点)分配一个不同的标签,从1到15。我们使用 np.min_scalar_type 来确定表示时间点数量所需的最小整数数据类型:
label_dtype = np.min_scalar_type(n_z)
mask_sequence = mask_sequence.astype(label_dtype)
labels = np.arange(1, n_z + 1, dtype=label_dtype)
mask_sequence *= labels[:, np.newaxis, np.newaxis]
让我们计算所有这些标记区域的感兴趣区域属性。
props = measure.regionprops_table(
    mask_sequence,
    intensity_image=image_sequence[:, 1, :, :],
    properties=('label', 'area', 'intensity_mean'),
)
np.testing.assert_array_equal(props['label'], np.arange(n_z) + 1)

fluorescence_change = [
    props['area'][i] * props['intensity_mean'][i] for i in range(n_z)
]

fluorescence_change /= fluorescence_change[0]  # normalization

fig, ax = plt.subplots()
ax.plot(fluorescence_change, 'rs')
ax.grid()
ax.set_xlabel('Time point')
ax.set_ylabel('Normalized total intensity')
ax.set_title('Change in fluorescence intensity at the nuclear envelope')
fig.tight_layout()

plt.show()

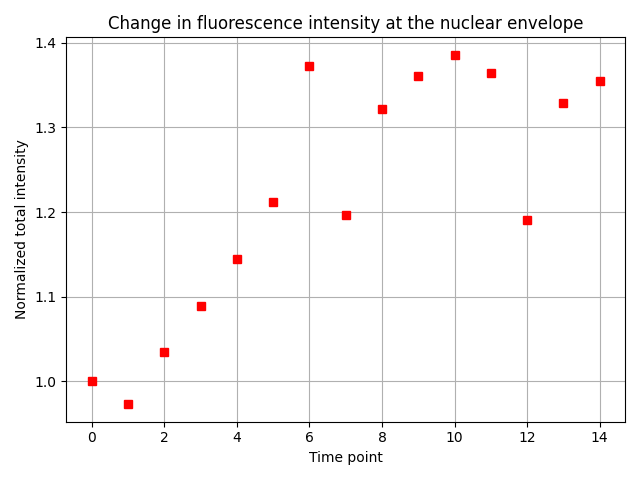
令人欣慰的是,我们发现了预期的结果:在最初的五个时间点,核膜处的总荧光强度增加了1.3倍,然后变得大致恒定。
脚本总运行时间: (0 分钟 0.661 秒)
