备注
转到结尾 下载完整的示例代码。或者通过 Binder 在浏览器中运行此示例。
GLCM 纹理特征#
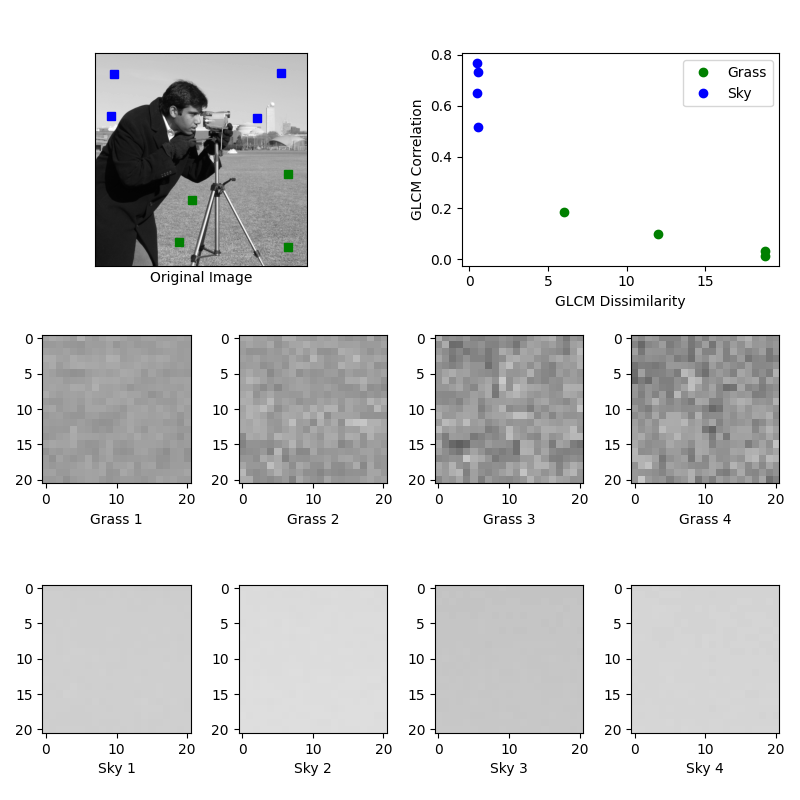
此示例展示了使用灰度共生矩阵(GLCMs)[1]_ 进行纹理分类。GLCM 是图像中在给定偏移量下共同出现的灰度值的直方图。
在这个例子中,从一张图像中提取了两种不同纹理的样本:草地区域和天空区域。对于每个补丁,计算了一个水平偏移为5的GLCM(distance=[5] 和 angles=[0])。接下来,计算了GLCM矩阵的两个特征:不相似性和相关性。这些特征被绘制出来,以说明类别在特征空间中形成簇。在一个典型的分类问题中,最后一步(本例中未包含)将是训练一个分类器,例如逻辑回归,来标记来自新图像的图像补丁。
在 0.19 版本发生变更: greymatrix 在 0.19 版本中被重命名为 graymatrix。
在 0.19 版本发生变更: greycoprops 在 0.19 版本中被重命名为 graycoprops。
参考文献#

import matplotlib.pyplot as plt

from skimage.feature import graycomatrix, graycoprops
from skimage import data


PATCH_SIZE = 21

# open the camera image
image = data.camera()

# select some patches from grassy areas of the image
grass_locations = [(280, 454), (342, 223), (444, 192), (455, 455)]
grass_patches = []
for loc in grass_locations:
    grass_patches.append(
        image[loc[0] : loc[0] + PATCH_SIZE, loc[1] : loc[1] + PATCH_SIZE]
    )

# select some patches from sky areas of the image
sky_locations = [(38, 34), (139, 28), (37, 437), (145, 379)]
sky_patches = []
for loc in sky_locations:
    sky_patches.append(
        image[loc[0] : loc[0] + PATCH_SIZE, loc[1] : loc[1] + PATCH_SIZE]
    )

# compute some GLCM properties each patch
xs = []
ys = []
for patch in grass_patches + sky_patches:
    glcm = graycomatrix(
        patch, distances=[5], angles=[0], levels=256, symmetric=True, normed=True
    )
    xs.append(graycoprops(glcm, 'dissimilarity')[0, 0])
    ys.append(graycoprops(glcm, 'correlation')[0, 0])

# create the figure
fig = plt.figure(figsize=(8, 8))

# display original image with locations of patches
ax = fig.add_subplot(3, 2, 1)
ax.imshow(image, cmap=plt.cm.gray, vmin=0, vmax=255)
for y, x in grass_locations:
    ax.plot(x + PATCH_SIZE / 2, y + PATCH_SIZE / 2, 'gs')
for y, x in sky_locations:
    ax.plot(x + PATCH_SIZE / 2, y + PATCH_SIZE / 2, 'bs')
ax.set_xlabel('Original Image')
ax.set_xticks([])
ax.set_yticks([])
ax.axis('image')

# for each patch, plot (dissimilarity, correlation)
ax = fig.add_subplot(3, 2, 2)
ax.plot(xs[: len(grass_patches)], ys[: len(grass_patches)], 'go', label='Grass')
ax.plot(xs[len(grass_patches) :], ys[len(grass_patches) :], 'bo', label='Sky')
ax.set_xlabel('GLCM Dissimilarity')
ax.set_ylabel('GLCM Correlation')
ax.legend()

# display the image patches
for i, patch in enumerate(grass_patches):
    ax = fig.add_subplot(3, len(grass_patches), len(grass_patches) * 1 + i + 1)
    ax.imshow(patch, cmap=plt.cm.gray, vmin=0, vmax=255)
    ax.set_xlabel(f"Grass {i + 1}")

for i, patch in enumerate(sky_patches):
    ax = fig.add_subplot(3, len(sky_patches), len(sky_patches) * 2 + i + 1)
    ax.imshow(patch, cmap=plt.cm.gray, vmin=0, vmax=255)
    ax.set_xlabel(f"Sky {i + 1}")


# display the patches and plot
fig.suptitle('Grey level co-occurrence matrix features', fontsize=14, y=1.05)
plt.tight_layout()
plt.show()
脚本总运行时间: (0 分钟 0.250 秒)
