PartialDependenceDisplay#
- class sklearn.inspection.PartialDependenceDisplay(pd_results, *, features, feature_names, target_idx, deciles, kind='average', subsample=1000, random_state=None, is_categorical=None)#
部分依赖图 (PDP)。
这也可以显示个体部分依赖,通常被称为:个体条件期望 (ICE)。
建议使用
from_estimator来创建一个PartialDependenceDisplay。所有参数都存储为属性。更多信息请参阅 使用部分依赖的高级绘图 和 用户指南 。
Added in version 0.22.
- Parameters:
- pd_resultslist of Bunch
partial_dependence对features的结果。- featureslist of (int,) or list of (int, int)
给定图的特征索引。一个整数的元组将绘制一个特征的部分依赖曲线。两个整数的元组将绘制一个二维部分依赖曲线作为等高线图。
- feature_nameslist of str
对应于
features中索引的特征名称。- target_idxint
在多类设置中,指定应为其计算 PDP 的类。请注意,对于二分类,总是使用正类(索引 1)。
在多输出设置中,指定应为其计算 PDP 的任务。
在二分类或经典回归设置中忽略。
- decilesdict
features中特征索引的十分位数。- kind{‘average’, ‘individual’, ‘both’} or list of such str, default=’average’
是否绘制所有样本的平均部分依赖或每个样本一条线或两者都绘制。
kind='average'结果是传统的 PD 图;kind='individual'结果是 ICE 图;kind='both'结果是在同一图上绘制 ICE 和 PD。
可以提供一个这样的字符串列表来为每个图指定
kind。列表的长度应与features中请求的交互次数相同。Note
ICE (‘individual’ 或 ‘both’) 对于 2 路交互图不是有效选项。因此,将引发错误。2 路交互图应始终配置为使用 ‘average’ kind。
Note
method='recursion'选项仅适用于kind='average'和sample_weights=None。计算个体依赖和加权平均需要使用较慢的method='brute'。Added in version 0.24: 添加
kind参数,包含'average'、'individual'和'both'选项。Added in version 1.1: 添加为每个图传递字符串列表指定
kind的可能性。- subsamplefloat, int or None, default=1000
当
kind为 ‘individual’ 或 ‘both’ 时 ICE 曲线的采样。如果为浮点数,应在 0.0 和 1.0 之间,并表示用于绘制 ICE 曲线的数据集比例。如果为整数,表示使用的最大绝对样本数。请注意,当
kind='both'时,仍使用完整数据集计算部分依赖。Added in version 0.24.
- random_stateint, RandomState instance or None, default=None
控制选择样本时的随机性,当 subsamples 不为
None时。详见 Glossary 。Added in version 0.24.
- is_categoricallist of (bool,) or list of (bool, bool), default=None
每个目标特征在
features中是否为分类特征。列表大小应与features相同。如果为None,则所有特征都被认为是连续的。Added in version 1.2.
- Attributes:
- bounding_ax_matplotlib Axes or None
如果
ax是轴或 None,bounding_ax_是绘制部分依赖图网格的轴。如果ax是轴列表或轴的 numpy 数组,bounding_ax_为 None。- axes_ndarray of matplotlib Axes
如果
ax是轴或 None,axes_[i, j]是第 i 行第 j 列的轴。如果ax是轴列表,axes_[i]是ax中的第 i 项。None 元素对应于该位置不存在的轴。- lines_ndarray of matplotlib Artists
如果
ax是轴或 None,lines_[i, j]是第 i 行第 j 列的部分依赖曲线。如果ax是轴列表,lines_[i]是对应于ax中第 i 项的部分依赖曲线。None 元素对应于不存在的轴或不包含线图的轴。- deciles_vlines_ndarray of matplotlib LineCollection
如果
ax是轴或 None,vlines_[i, j]是第 i 行第 j 列的 x 轴十分位线的线集合。如果ax是轴列表,vlines_[i]对应于ax中的第 i 项。None 元素对应于不存在的轴或不包含 PDP 图的轴。Added in version 0.23.
- deciles_hlines_ndarray of matplotlib LineCollection
如果
ax是轴或 None,vlines_[i, j]是第 i 行第 j 列的 y 轴十分位线的线集合。如果ax是轴列表,vlines_[i]对应于ax中的第 i 项。None 元素对应于不存在的轴或不包含 2 路图的轴。Added in version 0.23.
- contours_ndarray of matplotlib Artists
如果
ax是轴或 None,contours_[i, j]是第 i 行第 j 列的部分依赖图。如果ax是轴列表,contours_[i]是对应于ax中第 i 项的部分依赖图。None 元素对应于不存在的轴或不包含等高线图的轴。- bars_ndarray of matplotlib Artists
如果
ax是轴或 None,bars_[i, j]是第 i 行第 j 列的部分依赖条形图(对于分类特征)。如果ax是轴列表,bars_[i]是对应于ax中第 i 项的部分依赖条形图。None 元素对应于不存在的轴或不包含条形图的轴。Added in version 1.2.
- heatmaps_ndarray of matplotlib Artists
如果
ax是轴或 None,heatmaps_[i, j]是第 i 行第 j 列的部分依赖热图(对于一对分类特征)。如果ax是轴列表,heatmaps_[i]是对应于ax中第 i 项的部分依赖热图。None 元素对应于不存在的轴或不包含热图的轴。Added in version 1.2.
- figure_matplotlib Figure
包含部分依赖图的图形。
See also
partial_dependence计算部分依赖值。
PartialDependenceDisplay.from_estimator绘制部分依赖。
Examples
>>> import numpy as np
>>> import matplotlib.pyplot as plt
>>> from sklearn.datasets import make_friedman1
>>> from sklearn.ensemble import GradientBoostingRegressor
>>> from sklearn.inspection import PartialDependenceDisplay
>>> from sklearn.inspection import partial_dependence
>>> X, y = make_friedman1()
>>> clf = GradientBoostingRegressor(n_estimators=10).fit(X, y)
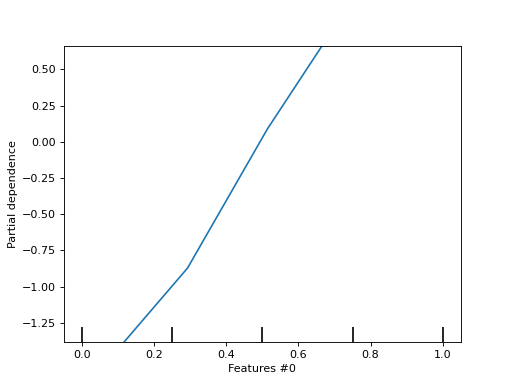
>>> features, feature_names = [(0,)], [f"Features #{i}" for i in range(X.shape[1])]
>>> deciles = {0: np.linspace(0, 1, num=5)}
>>> pd_results = partial_dependence(
...     clf, X, features=0, kind="average", grid_resolution=5)
>>> display = PartialDependenceDisplay(
...     [pd_results], features=features, feature_names=feature_names,
...     target_idx=0, deciles=deciles
... )
>>> display.plot(pdp_lim={1: (-1.38, 0.66)})
<...>
>>> plt.show()
- classmethod from_estimator(estimator, X, features, *, sample_weight=None, categorical_features=None, feature_names=None, target=None, response_method='auto', n_cols=3, grid_resolution=100, percentiles=(0.05, 0.95), method='auto', n_jobs=None, verbose=0, line_kw=None, ice_lines_kw=None, pd_line_kw=None, contour_kw=None, ax=None, kind='average', centered=False, subsample=1000, random_state=None)#
部分依赖(PD)和个体条件期望(ICE)图。
部分依赖图、个体条件期望图或两者的叠加可以通过设置
kind参数来绘制。len(features)个图将排列在一个具有n_cols列的网格中。双向部分依赖图将绘制为等高线图。特征值的十分位数将显示在一维图的x轴上,以及二维图的x轴和y轴上。更多信息请参阅 用户指南 。
Note
PartialDependenceDisplay.from_estimator不支持在多次调用中使用相同的轴。要绘制多个估计器的部分依赖图,请将第一次调用创建的轴传递给第二次调用:>>> from sklearn.inspection import PartialDependenceDisplay >>> from sklearn.datasets import make_friedman1 >>> from sklearn.linear_model import LinearRegression >>> from sklearn.ensemble import RandomForestRegressor >>> X, y = make_friedman1() >>> est1 = LinearRegression().fit(X, y) >>> est2 = RandomForestRegressor().fit(X, y) >>> disp1 = PartialDependenceDisplay.from_estimator(est1, X, ... [1, 2]) >>> disp2 = PartialDependenceDisplay.from_estimator(est2, X, [1, 2], ... ax=disp1.axes_)
Warning
对于
GradientBoostingClassifier和GradientBoostingRegressor,'recursion'方法(默认使用)不会考虑提升过程中的init预测器。实际上,这将产生与'brute'方法相同的值,直到目标响应中的一个常数偏移量,前提是init是一个常数估计器(这是默认的)。然而,如果init不是常数估计器,'recursion'方法的部分依赖值将不正确,因为偏移量将是样本依赖的。最好使用'brute'方法。请注意,这仅适用于GradientBoostingClassifier和GradientBoostingRegressor,不适用于HistGradientBoostingClassifier和HistGradientBoostingRegressor。Added in version 1.0.
- Parameters:
- estimatorBaseEstimator
一个已拟合的估计器对象,实现 predict 、 predict_proba 或 decision_function 。 不支持多输出多类分类器。
- X{array-like, dataframe} of shape (n_samples, n_features)
X用于生成目标features的网格值(其中将评估部分依赖), 并且在method为'brute'时生成补全特征的值。- featureslist of {int, str, pair of int, pair of str}
要为其创建PDP的目标特征。 如果
features[i]是整数或字符串,则创建一维PDP; 如果features[i]是元组,则创建二维PDP(仅在kind='average'时支持)。 每个元组的大小必须为2。 如果任何条目是字符串,则它必须在feature_names中。- sample_weightarray-like of shape (n_samples,), default=None
样本权重用于计算加权平均值时。如果为
None,则样本等权重。 如果sample_weight不是None,则method将设置为'brute'。 请注意,sample_weight对于kind='individual'被忽略。Added in version 1.3.
- categorical_featuresarray-like of shape (n_features,) or shape (n_categorical_features,), dtype={bool, int, str}, default=None
指示分类特征。
None:不考虑任何特征为分类特征;布尔数组类:形状为
(n_features,)的布尔掩码 指示哪些特征是分类特征。因此,此数组的形状与X.shape[1]相同;整数或字符串数组类:整数索引或字符串 指示分类特征。
Added in version 1.2.
- feature_namesarray-like of shape (n_features,), dtype=str, default=None
每个特征的名称;
feature_names[i]持有索引为i的特征的名称。 默认情况下,特征的名称对应于它们的数值索引(对于NumPy数组)和pandas dataframe的列名。- targetint, default=None
在多类设置中,指定应为其计算PDP的类。请注意,对于二分类,始终使用正类(索引1)。
在多输出设置中,指定应为其计算PDP的任务。
在二分类或经典回归设置中被忽略。
- response_method{‘auto’, ‘predict_proba’, ‘decision_function’}, default=’auto’
指定使用 predict_proba 还是 decision_function 作为目标响应。对于回归器, 此参数被忽略,响应始终是 predict 的输出。默认情况下,首先尝试 predict_proba , 如果不存在,则回退到 decision_function 。如果
method是'recursion',响应始终是 decision_function 的输出。- n_colsint, default=3
网格图中列的最大数量。仅在
ax是单个轴或None时有效。- grid_resolutionint, default=100
每个目标特征的图轴上等间距点的数量。
- percentilestuple of float, default=(0.05, 0.95)
用于创建PDP轴极端值的下限和上限百分位数。必须在 [0, 1] 范围内。
- methodstr, default=’auto’
用于计算平均预测的方法:
'recursion'仅支持某些基于树的估计器 (即GradientBoostingClassifier,GradientBoostingRegressor,HistGradientBoostingClassifier,HistGradientBoostingRegressor,DecisionTreeRegressor,RandomForestRegressor但在速度上更高效。 使用此方法,分类器的目标响应始终是决策函数,而不是预测概率。由于'recursion'方法隐式地通过设计计算ICE的平均值,因此它不兼容ICE,因此kind必须是'average'。'brute'适用于任何估计器,但计算量更大。'auto':对于支持它的估计器使用'recursion',否则使用'brute'。如果sample_weight不是None,则无论估计器如何,都使用'brute'。
请参阅 此注释 了解
'brute'和'recursion'方法之间的差异。- n_jobsint, default=None
用于计算部分依赖的CPU数量。 计算在
features参数指定的特征上并行化。None表示 1,除非在joblib.parallel_backend上下文中。-1表示使用所有处理器。有关更多详细信息,请参阅 Glossary 。- verboseint, default=0
部分依赖计算期间的详细输出。
- line_kwdict, default=None
传递给
matplotlib.pyplot.plot调用的字典。 用于一维部分依赖图。它可以用于定义ice_lines_kw和pdp_line_kw的常见属性。- ice_lines_kwdict, default=None
传递给
matplotlib.pyplot.plot调用的字典。 用于一维部分依赖图中ICE线的字典。ice_lines_kw中定义的键值对优先于line_kw。- pd_line_kwdict, default=None
传递给
matplotlib.pyplot.plot调用的字典。 用于一维部分依赖图中部分依赖的字典。pd_line_kw中定义的键值对优先于line_kw。- contour_kwdict, default=None
传递给
matplotlib.pyplot.contourf调用的字典。 用于二维部分依赖图。- axMatplotlib axes or array-like of Matplotlib axes, default=None
如果传递单个轴,则将其视为边界轴,并在其内部绘制部分依赖图网格。
n_cols参数控制网格中的列数。如果传递轴数组类,则直接在这些轴中绘制部分依赖图。
如果为
None,则创建图形和边界轴,并视为单轴情况。
- kind{‘average’, ‘individual’, ‘both’}, default=’average’
是否绘制部分依赖图,每个样本一条线,或两者都绘制。
kind='average'结果是传统的PD图;kind='individual'结果是ICE图。
请注意,快速
method='recursion'选项仅适用于kind='average'和sample_weights=None。计算个体依赖并进行加权平均需要使用较慢的method='brute'。- centeredbool, default=False
如果为
True,ICE和PD线将从y轴的原点开始。默认情况下不进行中心化。Added in version 1.1.
- subsamplefloat, int or None, default=1000
当
kind为 ‘individual’ 或 ‘both’ 时的ICE曲线采样。 如果为float,应在 0.0 和 1.0 之间,并表示用于绘制ICE曲线的数据集比例。如果为int,表示要使用的样本绝对数量。请注意,当
kind='both'时,仍使用完整数据集计算平均部分依赖。- random_stateint, RandomState instance or None, default=None
控制当 subsamples 不是
None且kind为'both'或'individual'时所选样本的随机性。 有关详细信息,请参阅 Glossary 。
- Returns:
- display
PartialDependenceDisplay
- display
See also
partial_dependence计算部分依赖值。
Examples
>>> import matplotlib.pyplot as plt
>>> from sklearn.datasets import make_friedman1
>>> from sklearn.ensemble import GradientBoostingRegressor
>>> from sklearn.inspection import PartialDependenceDisplay
>>> X, y = make_friedman1()
>>> clf = GradientBoostingRegressor(n_estimators=10).fit(X, y)
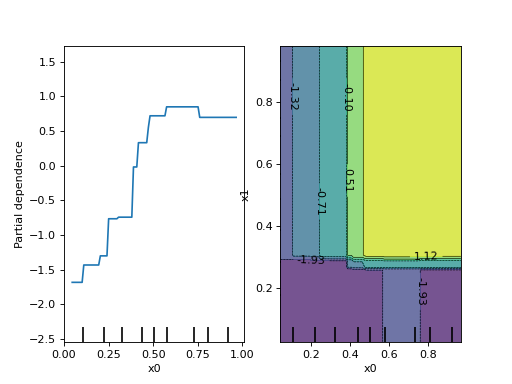
>>> PartialDependenceDisplay.from_estimator(clf, X, [0, (0, 1)])
<...>
>>> plt.show()
- plot(*, ax=None, n_cols=3, line_kw=None, ice_lines_kw=None, pd_line_kw=None, contour_kw=None, bar_kw=None, heatmap_kw=None, pdp_lim=None, centered=False)#
绘制部分依赖图。
- Parameters:
- axMatplotlib轴或Matplotlib轴的类数组对象,默认=None
如果传递单个轴,则将其视为边界轴,并在这些边界内绘制部分依赖图网格。
n_cols参数控制网格中的列数。如果传递轴的类数组对象,则部分依赖图将直接绘制到这些轴中。
如果为
None,则创建图形和边界轴,并视为单轴情况。
- n_colsint, 默认=3
网格图中的最大列数。仅在
ax为单个轴或None时有效。- line_kwdict, 默认=None
传递给
matplotlib.pyplot.plot调用的字典。用于一维部分依赖图。- ice_lines_kwdict, 默认=None
传递给
matplotlib.pyplot.plot调用的字典。用于一维部分依赖图中的ICE线。ice_lines_kw中定义的键值对优先于line_kw。Added in version 1.0.
- pd_line_kwdict, 默认=None
传递给
matplotlib.pyplot.plot调用的字典。用于一维部分依赖图中的部分依赖。pd_line_kw中定义的键值对优先于line_kw。Added in version 1.0.
- contour_kwdict, 默认=None
传递给
matplotlib.pyplot.contourf调用的字典。用于二维部分依赖图。- bar_kwdict, 默认=None
传递给
matplotlib.pyplot.bar调用的字典。用于一维分类部分依赖图。Added in version 1.2.
- heatmap_kwdict, 默认=None
传递给
matplotlib.pyplot.imshow调用的字典。用于二维分类部分依赖图。Added in version 1.2.
- pdp_limdict, 默认=None
全局平均预测的最小值和最大值,使得所有图将具有相同的尺度和平移限制。
pdp_lim[1]是单个部分依赖曲线的全局最小值和最大值。pdp_lim[2]是二维部分依赖曲线的全局最小值和最大值。如果为None(默认),则限制将从所有预测的全局最小值和最大值推断。Added in version 1.1.
- centeredbool, 默认=False
如果为
True,ICE和PD线将从y轴的原点开始。默认情况下,不进行中心化。Added in version 1.1.
- Returns:
- display
PartialDependenceDisplay 返回包含部分依赖图的:class:
~sklearn.inspection.PartialDependenceDisplay对象。
- display

