Note
Go to the end to download the full example code. or to run this example in your browser via Binder
将希腊硬币的图片分割成多个区域#
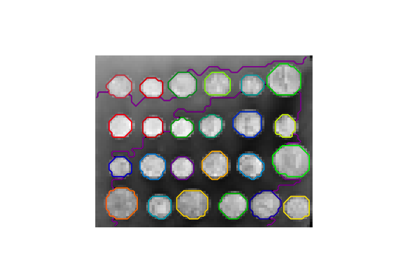
本示例使用图像中体素间差异创建的图上的光谱聚类来将图像分割成多个部分同质的区域。
这种方法(图像上的光谱聚类)是找到归一化图割问题的高效近似解决方案。
有三种分配标签的选项:
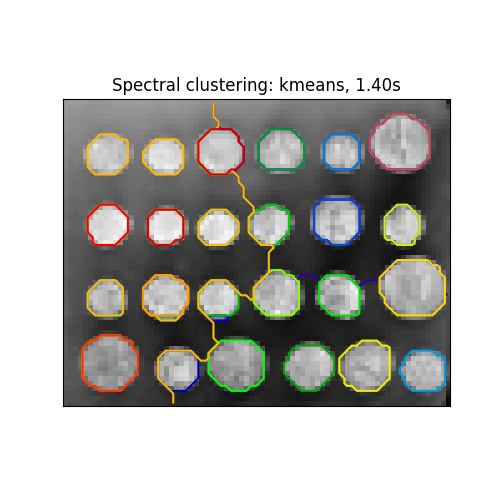
‘kmeans’ 光谱聚类在嵌入空间中使用kmeans算法对样本进行聚类
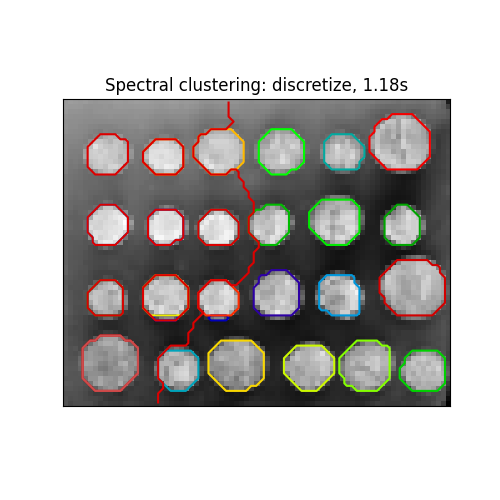
‘discrete’ 迭代搜索与光谱聚类的嵌入空间最接近的分区空间
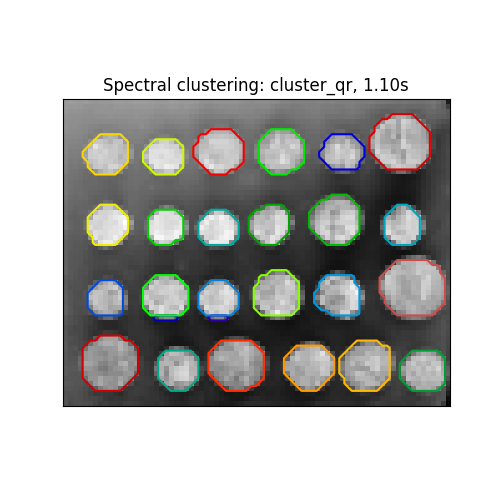
‘cluster_qr’ 使用带枢轴的QR分解直接在嵌入空间中确定分区来分配标签
# 作者:scikit-learn 开发者
# SPDX-License-Identifier: BSD-3-Clause

import time

import matplotlib.pyplot as plt
import numpy as np
from scipy.ndimage import gaussian_filter
from skimage.data import coins
from skimage.transform import rescale

from sklearn.cluster import spectral_clustering
from sklearn.feature_extraction import image

# 将硬币加载为numpy数组
orig_coins = coins()

# 将其调整为原始大小的20%以加快处理速度
# 在缩小之前应用高斯滤波进行平滑处理可以减少混叠伪影。
smoothened_coins = gaussian_filter(orig_coins, sigma=2)
rescaled_coins = rescale(smoothened_coins, 0.2, mode="reflect", anti_aliasing=False)

# 将图像转换为具有边缘梯度值的图。
graph = image.img_to_graph(rescaled_coins)

# 取梯度的递减函数:指数函数
# beta 越小,分割与实际图像的独立性越强。对于 beta=1,分割接近于 Voronoi 图。
beta = 10
eps = 1e-6
graph.data = np.exp(-beta * graph.data / graph.data.std()) + eps

# 需要手动选择要显示的分割区域数量。
# 当前版本的'spectral_clustering'不支持自动确定高质量聚类的数量。
n_regions = 26
计算并可视化结果区域
# 计算一些额外的特征向量可能会加快特征值求解器的速度。
# 请求额外的分割区域也可能提高谱聚类的质量。
n_regions_plus = 3

# 使用默认的特征值求解器 'arpack' 进行谱聚类。
# 可以使用任何已实现的求解器:eigen_solver='arpack'、'lobpcg' 或 'amg'。
# 选择 eigen_solver='amg' 需要额外的包 'pyamg'。
# 分割质量和计算速度主要由求解器的选择和容差 'eigen_tol' 的值决定。
# TODO: 对于 'lobpcg' 和 'amg',改变 eigen_tol 似乎没有效果。
for assign_labels in ("kmeans", "discretize", "cluster_qr"):
    t0 = time.time()
    labels = spectral_clustering(
        graph,
        n_clusters=(n_regions + n_regions_plus),
        eigen_tol=1e-7,
        assign_labels=assign_labels,
        random_state=42,
    )

    t1 = time.time()
    labels = labels.reshape(rescaled_coins.shape)
    plt.figure(figsize=(5, 5))
    plt.imshow(rescaled_coins, cmap=plt.cm.gray)

    plt.xticks(())
    plt.yticks(())
    title = "Spectral clustering: %s, %.2fs" % (assign_labels, (t1 - t0))
    print(title)
    plt.title(title)
    for l in range(n_regions):
        colors = [plt.cm.nipy_spectral((l + 4) / float(n_regions + 4))]
        plt.contour(labels == l, colors=colors)
        # 要查看单个片段,请在 plt.pause(0.5) 中添加注释
plt.show()

# 待21194合并且21243修复后,检查哪个eigen_solver是最好的,并在此示例中明确设置eigen_solver='arpack'、'lobpcg'或'amg'以及eigen_tol。
Spectral clustering: kmeans, 1.40s
Spectral clustering: discretize, 1.18s
Spectral clustering: cluster_qr, 1.10s
Total running time of the script: (0 minutes 4.020 seconds)
Related examples

