Note
Go to the end to download the full example code. or to run this example in your browser via Binder
绘制由VotingClassifier计算的类别概率#
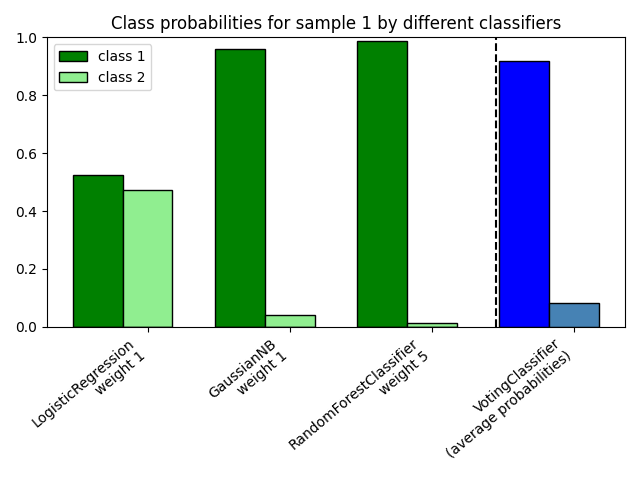
绘制玩具数据集中第一个样本的类别概率,该概率由三个不同的分类器预测并由
VotingClassifier 平均。
首先,初始化三个示例性分类器
(LogisticRegression , GaussianNB ,
和 RandomForestClassifier ),并使用权重 [1, 1, 5] 初始化一个
软投票 VotingClassifier ,这意味着在计算平均概率时,
RandomForestClassifier 的预测概率的权重是其他分类器的5倍。
为了可视化概率加权,我们将每个分类器拟合到训练集上,并绘制该示例数据集中第一个样本的预测类别概率。

import matplotlib.pyplot as plt
import numpy as np

from sklearn.ensemble import RandomForestClassifier, VotingClassifier
from sklearn.linear_model import LogisticRegression
from sklearn.naive_bayes import GaussianNB

clf1 = LogisticRegression(max_iter=1000, random_state=123)
clf2 = RandomForestClassifier(n_estimators=100, random_state=123)
clf3 = GaussianNB()
X = np.array([[-1.0, -1.0], [-1.2, -1.4], [-3.4, -2.2], [1.1, 1.2]])
y = np.array([1, 1, 2, 2])

eclf = VotingClassifier(
    estimators=[("lr", clf1), ("rf", clf2), ("gnb", clf3)],
    voting="soft",
    weights=[1, 1, 5],
)

# 预测所有分类器的类别概率
probas = [c.fit(X, y).predict_proba(X) for c in (clf1, clf2, clf3, eclf)]

# 获取数据集中第一个样本的类别概率
class1_1 = [pr[0, 0] for pr in probas]
class2_1 = [pr[0, 1] for pr in probas]


# plotting

N = 4  # number of groups
ind = np.arange(N)  # group positions
width = 0.35  # bar width

fig, ax = plt.subplots()

# 分类器1-3的条形图
p1 = ax.bar(ind, np.hstack(([class1_1[:-1], [0]])), width, color="green", edgecolor="k")
p2 = ax.bar(
    ind + width,
    np.hstack(([class2_1[:-1], [0]])),
    width,
    color="lightgreen",
    edgecolor="k",
)

# bars for VotingClassifier
p3 = ax.bar(ind, [0, 0, 0, class1_1[-1]], width, color="blue", edgecolor="k")
p4 = ax.bar(
    ind + width, [0, 0, 0, class2_1[-1]], width, color="steelblue", edgecolor="k"
)

# 图注
plt.axvline(2.8, color="k", linestyle="dashed")
ax.set_xticks(ind + width)
ax.set_xticklabels(
    [
        "LogisticRegression\nweight 1",
        "GaussianNB\nweight 1",
        "RandomForestClassifier\nweight 5",
        "VotingClassifier\n(average probabilities)",
    ],
    rotation=40,
    ha="right",
)
plt.ylim([0, 1])
plt.title("Class probabilities for sample 1 by different classifiers")
plt.legend([p1[0], p2[0]], ["class 1", "class 2"], loc="upper left")
plt.tight_layout()
plt.show()
Total running time of the script: (0 minutes 0.140 seconds)
Related examples


