Note
Go to the end to download the full example code. or to run this example in your browser via Binder
梯度提升中的类别特征支持#
在这个例子中,我们将比较 HistGradientBoostingRegressor 在不同类别特征编码策略下的训练时间和预测性能。特别是,我们将评估:
删除类别特征
使用
OrdinalEncoder并将类别视为有序的、等距的量使用
OrdinalEncoder并依赖HistGradientBoostingRegressor估计器的 原生类别支持 。
我们将使用 Ames Iowa Housing 数据集,该数据集包含数值和类别特征,其中房屋销售价格是目标。
请参阅 直方图梯度提升树的特性 以获取展示 HistGradientBoostingRegressor 其他特性示例的例子。
加载 Ames Housing 数据集#
首先,我们将 Ames Housing 数据加载为 pandas 数据框。特征可以是分类的或数值的:
from sklearn.datasets import fetch_openml

X, y = fetch_openml(data_id=42165, as_frame=True, return_X_y=True)

# 选择 X 的一个特征子集以使示例运行得更快
categorical_columns_subset = [
    "BldgType",
    "GarageFinish",
    "LotConfig",
    "Functional",
    "MasVnrType",
    "HouseStyle",
    "FireplaceQu",
    "ExterCond",
    "ExterQual",
    "PoolQC",
]

numerical_columns_subset = [
    "3SsnPorch",
    "Fireplaces",
    "BsmtHalfBath",
    "HalfBath",
    "GarageCars",
    "TotRmsAbvGrd",
    "BsmtFinSF1",
    "BsmtFinSF2",
    "GrLivArea",
    "ScreenPorch",
]

X = X[categorical_columns_subset + numerical_columns_subset]
X[categorical_columns_subset] = X[categorical_columns_subset].astype("category")

categorical_columns = X.select_dtypes(include="category").columns
n_categorical_features = len(categorical_columns)
n_numerical_features = X.select_dtypes(include="number").shape[1]

print(f"Number of samples: {X.shape[0]}")
print(f"Number of features: {X.shape[1]}")
print(f"Number of categorical features: {n_categorical_features}")
print(f"Number of numerical features: {n_numerical_features}")
Number of samples: 1460
Number of features: 20
Number of categorical features: 10
Number of numerical features: 10
使用删除了分类特征的梯度提升估计器#
作为基线,我们创建了一个删除了分类特征的估计器:
from sklearn.compose import make_column_selector, make_column_transformer
from sklearn.ensemble import HistGradientBoostingRegressor
from sklearn.pipeline import make_pipeline

dropper = make_column_transformer(
    ("drop", make_column_selector(dtype_include="category")), remainder="passthrough"
)
hist_dropped = make_pipeline(dropper, HistGradientBoostingRegressor(random_state=42))
带有独热编码的梯度提升估计器#
接下来,我们创建一个管道,对分类特征进行独热编码,并让其余的数值数据通过:
from sklearn.preprocessing import OneHotEncoder

one_hot_encoder = make_column_transformer(
    (
        OneHotEncoder(sparse_output=False, handle_unknown="ignore"),
        make_column_selector(dtype_include="category"),
    ),
    remainder="passthrough",
)

hist_one_hot = make_pipeline(
    one_hot_encoder, HistGradientBoostingRegressor(random_state=42)
)
梯度提升估计器与序数编码#
接下来,我们将创建一个管道,将分类特征视为有序量,即类别将被编码为0、1、2等,并作为连续特征处理。
import numpy as np

from sklearn.preprocessing import OrdinalEncoder

ordinal_encoder = make_column_transformer(
    (
        OrdinalEncoder(handle_unknown="use_encoded_value", unknown_value=np.nan),
        make_column_selector(dtype_include="category"),
    ),
    remainder="passthrough",
    # 使用简短的特征名称,以便在流水线的下一步中更容易在 HistGradientBoostingRegressor 中指定分类变量。
    verbose_feature_names_out=False,
)

hist_ordinal = make_pipeline(
    ordinal_encoder, HistGradientBoostingRegressor(random_state=42)
)
具有原生类别支持的梯度提升估计器#
我们现在创建一个 HistGradientBoostingRegressor 估计器,
它将原生处理类别特征。该估计器不会将类别特征视为有序数量。我们设置
categorical_features="from_dtype" ,以便具有类别数据类型的特征被视为类别特征。
这个估计器与之前的估计器的主要区别在于,在这个估计器中,我们让 HistGradientBoostingRegressor 从 DataFrame 列的 dtypes 中检测哪些特征是分类特征。
hist_native = HistGradientBoostingRegressor(
    random_state=42, categorical_features="from_dtype"
)
模型比较#
最后,我们使用交叉验证来评估模型。在这里,我们比较模型在
mean_absolute_percentage_error 和拟合时间方面的表现。
import matplotlib.pyplot as plt

from sklearn.model_selection import cross_validate

scoring = "neg_mean_absolute_percentage_error"
n_cv_folds = 3

dropped_result = cross_validate(hist_dropped, X, y, cv=n_cv_folds, scoring=scoring)
one_hot_result = cross_validate(hist_one_hot, X, y, cv=n_cv_folds, scoring=scoring)
ordinal_result = cross_validate(hist_ordinal, X, y, cv=n_cv_folds, scoring=scoring)
native_result = cross_validate(hist_native, X, y, cv=n_cv_folds, scoring=scoring)


def plot_results(figure_title):
    fig, (ax1, ax2) = plt.subplots(1, 2, figsize=(12, 8))

    plot_info = [
        ("fit_time", "Fit times (s)", ax1, None),
        ("test_score", "Mean Absolute Percentage Error", ax2, None),
    ]

    x, width = np.arange(4), 0.9
    for key, title, ax, y_limit in plot_info:
        items = [
            dropped_result[key],
            one_hot_result[key],
            ordinal_result[key],
            native_result[key],
        ]

        mape_cv_mean = [np.mean(np.abs(item)) for item in items]
        mape_cv_std = [np.std(item) for item in items]

        ax.bar(
            x=x,
            height=mape_cv_mean,
            width=width,
            yerr=mape_cv_std,
            color=["C0", "C1", "C2", "C3"],
        )
        ax.set(
            xlabel="Model",
            title=title,
            xticks=x,
            xticklabels=["Dropped", "One Hot", "Ordinal", "Native"],
            ylim=y_limit,
        )
    fig.suptitle(figure_title)


plot_results("Gradient Boosting on Ames Housing")
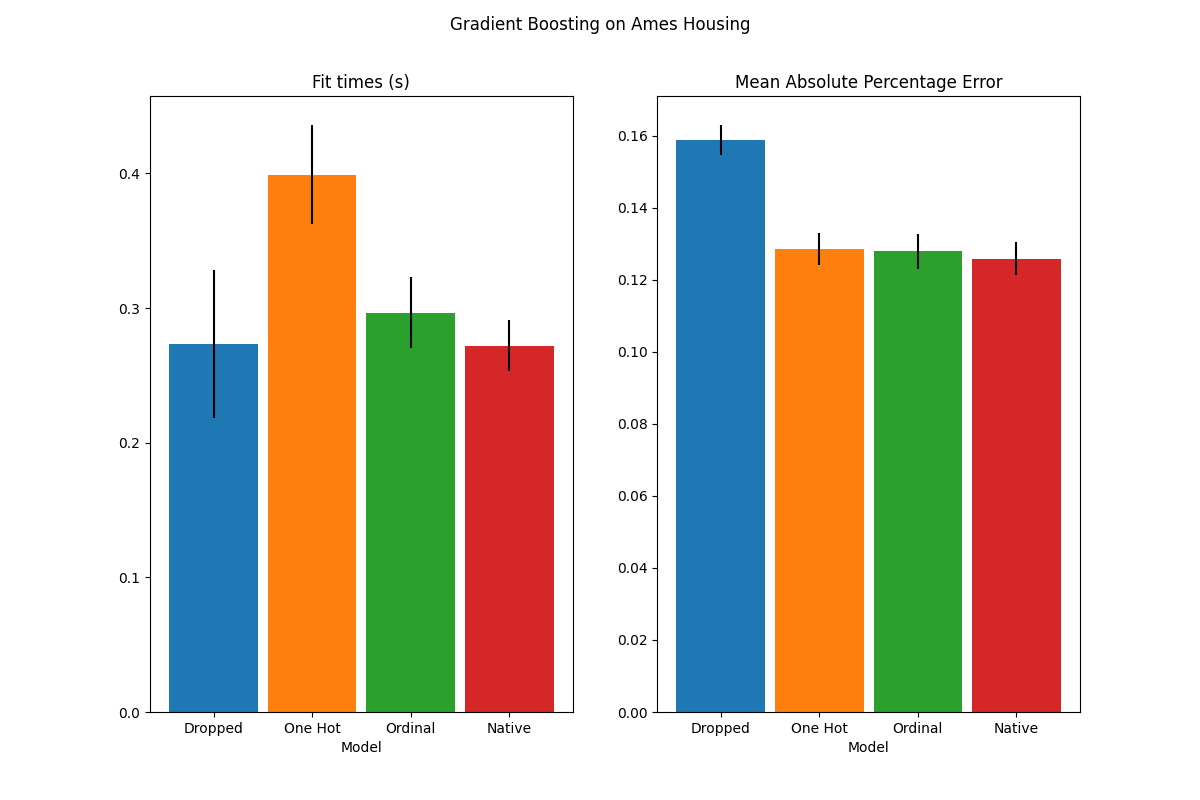
我们发现,使用独热编码数据的模型是最慢的。这是意料之中的,因为独热编码为每个类别值(对于每个分类特征)创建了一个额外的特征,因此在拟合过程中需要考虑更多的分割点。理论上,我们预计原生处理分类特征的速度会比将类别视为有序数量(“序数”)稍慢,因为原生处理需要对类别进行排序。然而,当类别数量较少时,拟合时间应该相近,这在实践中可能并不总是反映出来。
在预测性能方面,去掉类别特征会导致性能下降。使用类别特征的三个模型具有相当的错误率,其中原生处理方式略占优势。
限制分割次数#
通常情况下,可以预期使用独热编码数据会得到较差的预测结果,尤其是在树的深度或节点数量受限时:对于独热编码数据,需要更多的分割点,即更大的深度,才能恢复相当于原生处理方式下单个分割点所能获得的分割效果。
当类别被视为有序量时也是如此:如果类别是 A..F ,且最佳分割是 ACF - BDE ,则独热编码模型将需要 3 个分割点(左节点中每个类别一个),而有序非原生模型将需要 4 个分割点:1 个分割点隔离 A ,1 个分割点隔离 F ,以及 2 个分割点将 C 从 BCDE 中隔离出来。
模型性能在实际中的差异程度将取决于数据集和树的灵活性。
为了说明这一点,让我们使用欠拟合模型重新进行相同的分析,在这种情况下,我们通过限制树的数量和每棵树的深度来人为地限制总分裂数。
for pipe in (hist_dropped, hist_one_hot, hist_ordinal, hist_native):
    if pipe is hist_native:
        # 本地模型不使用流水线,因此我们可以直接设置参数。
        pipe.set_params(max_depth=3, max_iter=15)
    else:
        pipe.set_params(
            histgradientboostingregressor__max_depth=3,
            histgradientboostingregressor__max_iter=15,
        )

dropped_result = cross_validate(hist_dropped, X, y, cv=n_cv_folds, scoring=scoring)
one_hot_result = cross_validate(hist_one_hot, X, y, cv=n_cv_folds, scoring=scoring)
ordinal_result = cross_validate(hist_ordinal, X, y, cv=n_cv_folds, scoring=scoring)
native_result = cross_validate(hist_native, X, y, cv=n_cv_folds, scoring=scoring)

plot_results("Gradient Boosting on Ames Housing (few and small trees)")

plt.show()
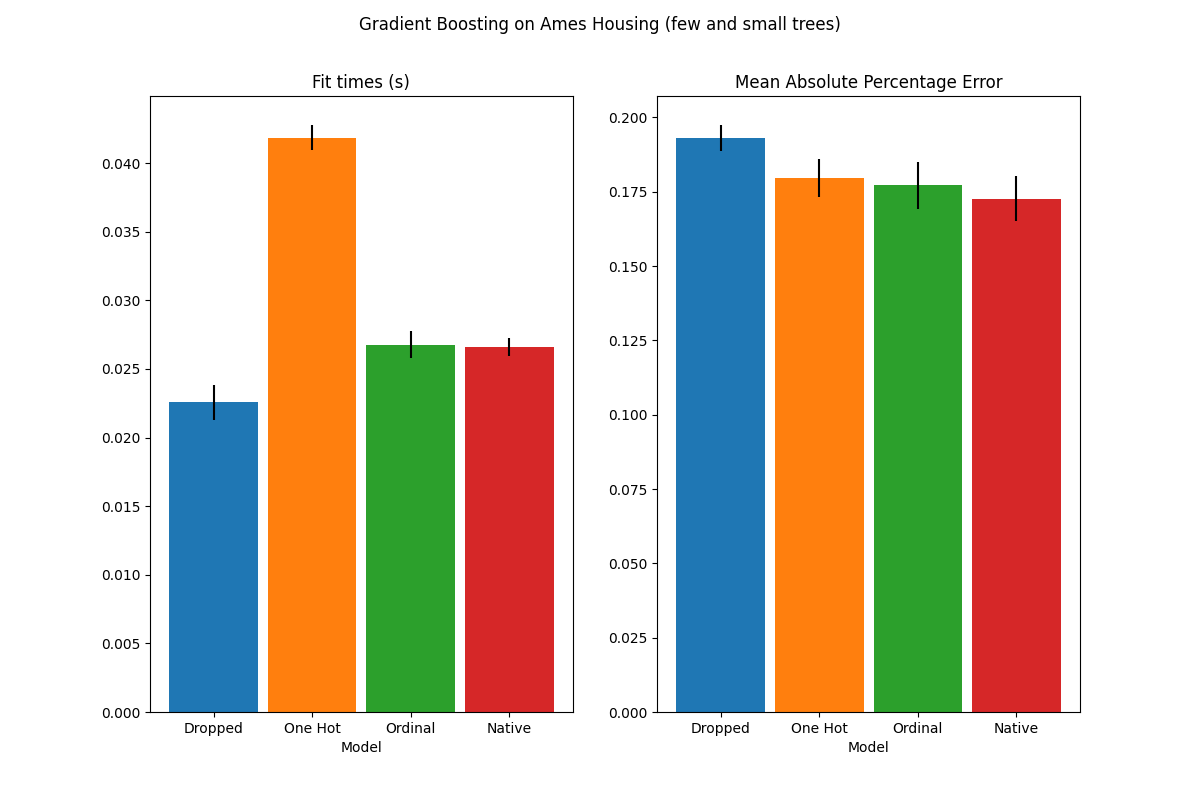
这些欠拟合模型的结果证实了我们之前的直觉:当分割预算受限时,原生类别处理策略表现最佳。其他两种策略(独热编码和将类别视为序数值)导致的误差值与完全丢弃类别特征的基线模型相当。
Total running time of the script: (0 minutes 4.403 seconds)
Related examples

