Note
Go to the end to download the full example code. or to run this example in your browser via Binder
鸢尾花数据集#
该数据集由3种不同类型的鸢尾花(山鸢尾、杂色鸢尾和维吉尼亚鸢尾)的花瓣和花萼长度组成,存储在一个150x4的numpy.ndarray中。
行表示样本,列表示:花萼长度、花萼宽度、花瓣长度和花瓣宽度。
下面的图使用了前两个特征。 有关此数据集的更多信息,请参见 这里 。
# 代码来源:Gaël Varoquaux
# 由Jaques Grobler修改用于文档
# SPDX许可证标识符:BSD-3-Clause
加载鸢尾花数据集#
from sklearn import datasets

iris = datasets.load_iris()
鸢尾花数据集的散点图#
import matplotlib.pyplot as plt

_, ax = plt.subplots()
scatter = ax.scatter(iris.data[:, 0], iris.data[:, 1], c=iris.target)
ax.set(xlabel=iris.feature_names[0], ylabel=iris.feature_names[1])
_ = ax.legend(
    scatter.legend_elements()[0], iris.target_names, loc="lower right", title="Classes"
)
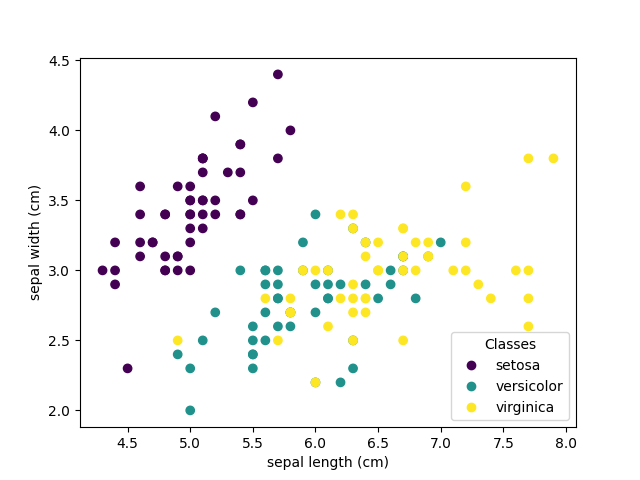
散点图中的每个点代表数据集中150朵鸢尾花中的一朵,颜色表示它们各自的类型(Setosa、Versicolour 和 Virginica)。你可以看到关于Setosa类型的一个模式,它基于其短而宽的萼片很容易识别。仅考虑这两个维度,萼片宽度和长度,Versicolor和Virginica类型之间仍然存在重叠。
绘制PCA表示#
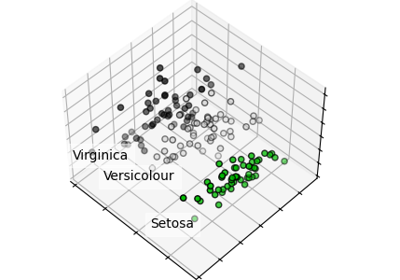
让我们对鸢尾花数据集应用主成分分析(PCA), 然后在前三个PCA维度上绘制鸢尾花。 这将使我们更好地区分这三种类型!
# 未使用但需要导入以使用低于3.2版本的matplotlib进行3D投影
import mpl_toolkits.mplot3d  # noqa: F401

from sklearn.decomposition import PCA

fig = plt.figure(1, figsize=(8, 6))
ax = fig.add_subplot(111, projection="3d", elev=-150, azim=110)

X_reduced = PCA(n_components=3).fit_transform(iris.data)
ax.scatter(
    X_reduced[:, 0],
    X_reduced[:, 1],
    X_reduced[:, 2],
    c=iris.target,
    s=40,
)

ax.set_title("First three PCA dimensions")
ax.set_xlabel("1st Eigenvector")
ax.xaxis.set_ticklabels([])
ax.set_ylabel("2nd Eigenvector")
ax.yaxis.set_ticklabels([])
ax.set_zlabel("3rd Eigenvector")
ax.zaxis.set_ticklabels([])

plt.show()
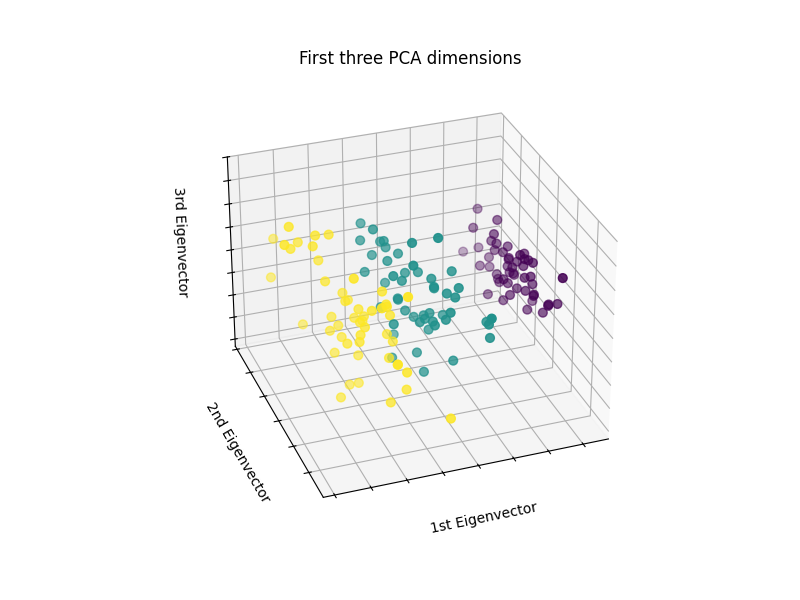
PCA 将创建 3 个新的特征,这些特征是 4 个原始特征的线性组合。此外,此转换最大化了方差。通过这种转换,我们可以看到仅使用第一个特征(即第一个特征值)就可以识别每个物种。
Total running time of the script: (0 minutes 0.091 seconds)
Related examples

