Note
Go to the end to download the full example code. or to run this example in your browser via Binder
使用堆叠方法结合预测器#
堆叠是指一种混合估计器的方法。在这种策略中,一些估计器在一些训练数据上单独拟合,而最终的估计器则使用这些基础估计器的堆叠预测进行训练。
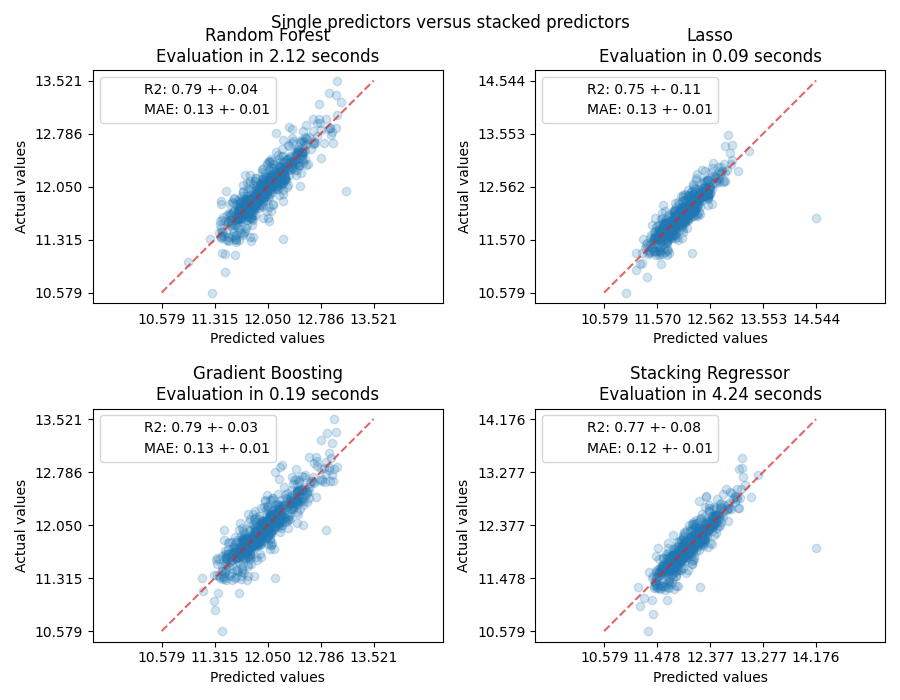
在这个例子中,我们说明了将不同的回归器堆叠在一起,并使用最终的线性惩罚回归器来输出预测的用例。我们比较了每个单独回归器与堆叠策略的性能。堆叠略微提高了整体性能。
# 作者:scikit-learn 开发者
# SPDX 许可证标识符:BSD-3-Clause
下载数据集
我们将使用 `Ames Housing`_ 数据集,该数据集最初由 Dean De Cock 编译,并在 Kaggle 挑战赛中使用后变得更加知名。该数据集包含爱荷华州艾姆斯市的 1460 套住宅,每套住宅由 80 个特征描述。我们将使用它来预测房屋的最终对数价格。在这个例子中,我们将只使用通过 GradientBoostingRegressor() 选择的 20 个最有趣的特征,并限制条目数量(在这里我们不会详细讨论如何选择最有趣的特征)。
Ames房价数据集并未随scikit-learn一起提供,因此我们将从 `OpenML`_ 获取它。
import numpy as np

from sklearn.datasets import fetch_openml
from sklearn.utils import shuffle


def load_ames_housing():
    df = fetch_openml(name="house_prices", as_frame=True)
    X = df.data
    y = df.target

    features = [
        "YrSold",
        "HeatingQC",
        "Street",
        "YearRemodAdd",
        "Heating",
        "MasVnrType",
        "BsmtUnfSF",
        "Foundation",
        "MasVnrArea",
        "MSSubClass",
        "ExterQual",
        "Condition2",
        "GarageCars",
        "GarageType",
        "OverallQual",
        "TotalBsmtSF",
        "BsmtFinSF1",
        "HouseStyle",
        "MiscFeature",
        "MoSold",
    ]

    X = X.loc[:, features]
    X, y = shuffle(X, y, random_state=0)

    X = X.iloc[:600]
    y = y.iloc[:600]
    return X, np.log(y)


X, y = load_ames_housing()
制作数据预处理的管道#
在使用 Ames 数据集之前,我们仍然需要进行一些预处理。首先,我们将选择数据集中的分类和数值列,以构建管道的第一步。
from sklearn.compose import make_column_selector

cat_selector = make_column_selector(dtype_include=object)
num_selector = make_column_selector(dtype_include=np.number)
cat_selector(X)
['HeatingQC', 'Street', 'Heating', 'MasVnrType', 'Foundation', 'ExterQual', 'Condition2', 'GarageType', 'HouseStyle', 'MiscFeature']
num_selector(X)
['YrSold', 'YearRemodAdd', 'BsmtUnfSF', 'MasVnrArea', 'MSSubClass', 'GarageCars', 'OverallQual', 'TotalBsmtSF', 'BsmtFinSF1', 'MoSold']
然后,我们需要设计依赖于最终回归器的预处理管道。如果最终回归器是线性模型,则需要对类别进行独热编码。如果最终回归器是基于树的模型,则使用序数编码器就足够了。此外,线性模型需要对数值进行标准化,而基于树的模型可以直接处理原始数值数据。然而,两种模型都需要一个插补器来处理缺失值。
我们将首先设计树模型所需的管道。
from sklearn.compose import make_column_transformer
from sklearn.impute import SimpleImputer
from sklearn.pipeline import make_pipeline
from sklearn.preprocessing import OrdinalEncoder

cat_tree_processor = OrdinalEncoder(
    handle_unknown="use_encoded_value",
    unknown_value=-1,
    encoded_missing_value=-2,
)
num_tree_processor = SimpleImputer(strategy="mean", add_indicator=True)

tree_preprocessor = make_column_transformer(
    (num_tree_processor, num_selector), (cat_tree_processor, cat_selector)
)
tree_preprocessor
然后,我们现在将定义当最终回归器是线性模型时使用的预处理器。
from sklearn.preprocessing import OneHotEncoder, StandardScaler

cat_linear_processor = OneHotEncoder(handle_unknown="ignore")
num_linear_processor = make_pipeline(
    StandardScaler(), SimpleImputer(strategy="mean", add_indicator=True)
)

linear_preprocessor = make_column_transformer(
    (num_linear_processor, num_selector), (cat_linear_processor, cat_selector)
)
linear_preprocessor
单个数据集上的预测器堆栈#
有时找到在给定数据集上表现最好的模型是很繁琐的。堆叠通过结合多个学习器的输出提供了一种替代方法,而无需特定选择一个模型。堆叠的性能通常接近最佳模型,有时甚至可以超越每个单独模型的预测性能。
在这里,我们结合了3个学习器(线性和非线性),并使用岭回归器将它们的输出结合在一起。
尽管我们将为3个学习器使用前一节中编写的处理器创建新的管道,但最终的估计器
RidgeCV()不需要对数据进行预处理,因为它将接收来自3个学习器的已预处理输出。
from sklearn.linear_model import LassoCV

lasso_pipeline = make_pipeline(linear_preprocessor, LassoCV())
lasso_pipeline
from sklearn.ensemble import RandomForestRegressor

rf_pipeline = make_pipeline(tree_preprocessor, RandomForestRegressor(random_state=42))
rf_pipeline
from sklearn.ensemble import HistGradientBoostingRegressor

gbdt_pipeline = make_pipeline(
    tree_preprocessor, HistGradientBoostingRegressor(random_state=0)
)
gbdt_pipeline
from sklearn.ensemble import StackingRegressor
from sklearn.linear_model import RidgeCV

estimators = [
    ("Random Forest", rf_pipeline),
    ("Lasso", lasso_pipeline),
    ("Gradient Boosting", gbdt_pipeline),
]

stacking_regressor = StackingRegressor(estimators=estimators, final_estimator=RidgeCV())
stacking_regressor
测量并绘制结果#
现在我们可以使用 Ames Housing 数据集进行预测。我们检查每个单独预测器以及回归器堆栈的性能。
import time

import matplotlib.pyplot as plt

from sklearn.metrics import PredictionErrorDisplay
from sklearn.model_selection import cross_val_predict, cross_validate

fig, axs = plt.subplots(2, 2, figsize=(9, 7))
axs = np.ravel(axs)

for ax, (name, est) in zip(
    axs, estimators + [("Stacking Regressor", stacking_regressor)]
):
    scorers = {"R2": "r2", "MAE": "neg_mean_absolute_error"}

    start_time = time.time()
    scores = cross_validate(
        est, X, y, scoring=list(scorers.values()), n_jobs=-1, verbose=0
    )
    elapsed_time = time.time() - start_time

    y_pred = cross_val_predict(est, X, y, n_jobs=-1, verbose=0)
    scores = {
        key: (
            f"{np.abs(np.mean(scores[f'test_{value}'])):.2f} +- "
            f"{np.std(scores[f'test_{value}']):.2f}"
        )
        for key, value in scorers.items()
    }

    display = PredictionErrorDisplay.from_predictions(
        y_true=y,
        y_pred=y_pred,
        kind="actual_vs_predicted",
        ax=ax,
        scatter_kwargs={"alpha": 0.2, "color": "tab:blue"},
        line_kwargs={"color": "tab:red"},
    )
    ax.set_title(f"{name}\nEvaluation in {elapsed_time:.2f} seconds")

    for name, score in scores.items():
        ax.plot([], [], " ", label=f"{name}: {score}")
    ax.legend(loc="upper left")

plt.suptitle("Single predictors versus stacked predictors")
plt.tight_layout()
plt.subplots_adjust(top=0.9)
plt.show()

堆叠回归器将结合不同回归器的优势。然而,我们也看到训练堆叠回归器在计算上要昂贵得多。
Total running time of the script: (0 minutes 12.720 seconds)
Related examples


