Note
Go to the end to download the full example code. or to run this example in your browser via Binder
SVM:最大间隔分离超平面#
使用线性核的支持向量机分类器,在一个可分的双类数据集中绘制最大间隔分离超平面。
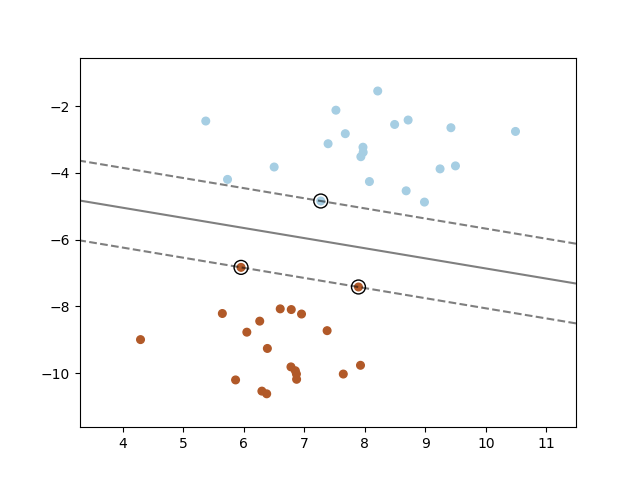
import matplotlib.pyplot as plt

from sklearn import svm
from sklearn.datasets import make_blobs
from sklearn.inspection import DecisionBoundaryDisplay

# 我们创建了40个可分离点
X, y = make_blobs(n_samples=40, centers=2, random_state=6)

# 拟合模型,不进行正则化以便说明目的
clf = svm.SVC(kernel="linear", C=1000)
clf.fit(X, y)

plt.scatter(X[:, 0], X[:, 1], c=y, s=30, cmap=plt.cm.Paired)

# plot the decision function
ax = plt.gca()
DecisionBoundaryDisplay.from_estimator(
    clf,
    X,
    plot_method="contour",
    colors="k",
    levels=[-1, 0, 1],
    alpha=0.5,
    linestyles=["--", "-", "--"],
    ax=ax,
)
# 绘制支持向量
ax.scatter(
    clf.support_vectors_[:, 0],
    clf.support_vectors_[:, 1],
    s=100,
    linewidth=1,
    facecolors="none",
    edgecolors="k",
)
plt.show()
Total running time of the script: (0 minutes 0.030 seconds)
Related examples

