Note
Go to the end to download the full example code. or to run this example in your browser via Binder
SVM:用于不平衡类别的分离超平面#
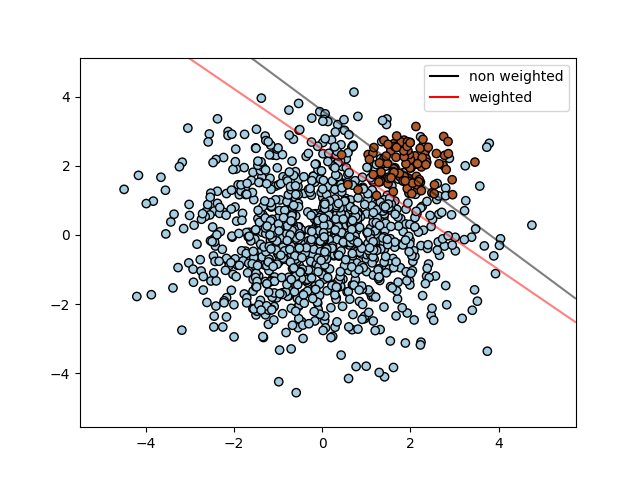
使用SVC为不平衡类别找到最优分离超平面。
我们首先使用普通的SVC找到分离平面,然后绘制(虚线)自动校正不平衡类别的分离超平面。
Note
通过将 SVC(kernel="linear") 替换为 SGDClassifier(loss="hinge") ,此示例也能正常工作。将:class:SGDClassifier 的 loss 参数设置为 hinge 将产生类似于具有线性核的SVC的行为。
例如,可以尝试替换 SVC 为:
clf = SGDClassifier(n_iter=100, alpha=0.01)
import matplotlib.lines as mlines
import matplotlib.pyplot as plt

from sklearn import svm
from sklearn.datasets import make_blobs
from sklearn.inspection import DecisionBoundaryDisplay

# 我们创建了两个随机点的簇
n_samples_1 = 1000
n_samples_2 = 100
centers = [[0.0, 0.0], [2.0, 2.0]]
clusters_std = [1.5, 0.5]
X, y = make_blobs(
    n_samples=[n_samples_1, n_samples_2],
    centers=centers,
    cluster_std=clusters_std,
    random_state=0,
    shuffle=False,
)

# 拟合模型并获得分离超平面
clf = svm.SVC(kernel="linear", C=1.0)
clf.fit(X, y)

# 拟合模型并使用加权类别获得分离超平面
wclf = svm.SVC(kernel="linear", class_weight={1: 10})
wclf.fit(X, y)

# 绘制样本
plt.scatter(X[:, 0], X[:, 1], c=y, cmap=plt.cm.Paired, edgecolors="k")

# 绘制两个分类器的决策函数
ax = plt.gca()
disp = DecisionBoundaryDisplay.from_estimator(
    clf,
    X,
    plot_method="contour",
    colors="k",
    levels=[0],
    alpha=0.5,
    linestyles=["-"],
    ax=ax,
)

# 为加权类别绘制决策边界和边距
wdisp = DecisionBoundaryDisplay.from_estimator(
    wclf,
    X,
    plot_method="contour",
    colors="r",
    levels=[0],
    alpha=0.5,
    linestyles=["-"],
    ax=ax,
)

plt.legend(
    [
        mlines.Line2D([], [], color="k", label="non weighted"),
        mlines.Line2D([], [], color="r", label="weighted"),
    ],
    ["non weighted", "weighted"],
    loc="upper right",
)
plt.show()
Total running time of the script: (0 minutes 0.081 seconds)
Related examples

