Note
Go to the end to download the full example code. or to run this example in your browser via Binder
二分类AdaBoost#
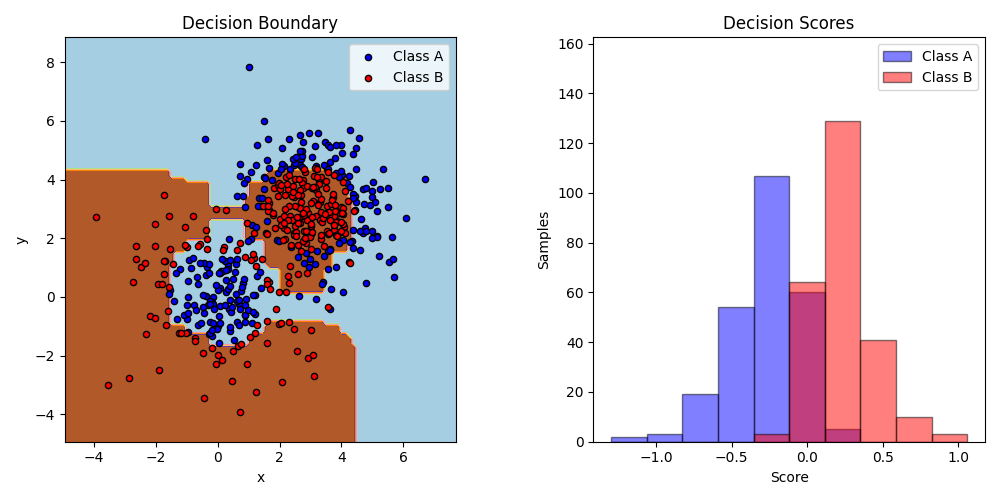
本示例在一个由两个“高斯分位数”簇(参见:sklearn.datasets.make_gaussian_quantiles )组成的非线性可分分类数据集上拟合了一个AdaBoost决策树桩,并绘制了决策边界和决策分数。决策分数的分布分别针对A类和B类样本进行展示。每个样本的预测类别标签由决策分数的符号决定。决策分数大于零的样本被分类为B类,否则被分类为A类。决策分数的大小决定了与预测类别标签的相似程度。此外,可以通过仅选择决策分数高于某个值的样本来构建一个包含所需纯度的B类的新数据集。

# 作者:scikit-learn 开发者
# SPDX-License-Identifier: BSD-3-Clause

import matplotlib.pyplot as plt
import numpy as np

from sklearn.datasets import make_gaussian_quantiles
from sklearn.ensemble import AdaBoostClassifier
from sklearn.inspection import DecisionBoundaryDisplay
from sklearn.tree import DecisionTreeClassifier

# 构建数据集
X1, y1 = make_gaussian_quantiles(
    cov=2.0, n_samples=200, n_features=2, n_classes=2, random_state=1
)
X2, y2 = make_gaussian_quantiles(
    mean=(3, 3), cov=1.5, n_samples=300, n_features=2, n_classes=2, random_state=1
)
X = np.concatenate((X1, X2))
y = np.concatenate((y1, -y2 + 1))

# 创建并拟合一个AdaBoost决策树
bdt = AdaBoostClassifier(
    DecisionTreeClassifier(max_depth=1), algorithm="SAMME", n_estimators=200
)

bdt.fit(X, y)

plot_colors = "br"
plot_step = 0.02
class_names = "AB"

plt.figure(figsize=(10, 5))

# 绘制决策边界
ax = plt.subplot(121)
disp = DecisionBoundaryDisplay.from_estimator(
    bdt,
    X,
    cmap=plt.cm.Paired,
    response_method="predict",
    ax=ax,
    xlabel="x",
    ylabel="y",
)
x_min, x_max = disp.xx0.min(), disp.xx0.max()
y_min, y_max = disp.xx1.min(), disp.xx1.max()
plt.axis("tight")

# Plot the training points
for i, n, c in zip(range(2), class_names, plot_colors):
    idx = np.where(y == i)
    plt.scatter(
        X[idx, 0],
        X[idx, 1],
        c=c,
        s=20,
        edgecolor="k",
        label="Class %s" % n,
    )
plt.xlim(x_min, x_max)
plt.ylim(y_min, y_max)
plt.legend(loc="upper right")

plt.title("Decision Boundary")

# Plot the two-class decision scores
twoclass_output = bdt.decision_function(X)
plot_range = (twoclass_output.min(), twoclass_output.max())
plt.subplot(122)
for i, n, c in zip(range(2), class_names, plot_colors):
    plt.hist(
        twoclass_output[y == i],
        bins=10,
        range=plot_range,
        facecolor=c,
        label="Class %s" % n,
        alpha=0.5,
        edgecolor="k",
    )
x1, x2, y1, y2 = plt.axis()
plt.axis((x1, x2, y1, y2 * 1.2))
plt.legend(loc="upper right")
plt.ylabel("Samples")
plt.xlabel("Score")
plt.title("Decision Scores")

plt.tight_layout()
plt.subplots_adjust(wspace=0.35)
plt.show()
Total running time of the script: (0 minutes 0.302 seconds)
Related examples


