Note
Go to the end to download the full example code. or to run this example in your browser via Binder
GMM 初始化方法#
高斯混合模型中不同初始化方法的示例
有关估计器的更多信息,请参见 高斯混合模型 。
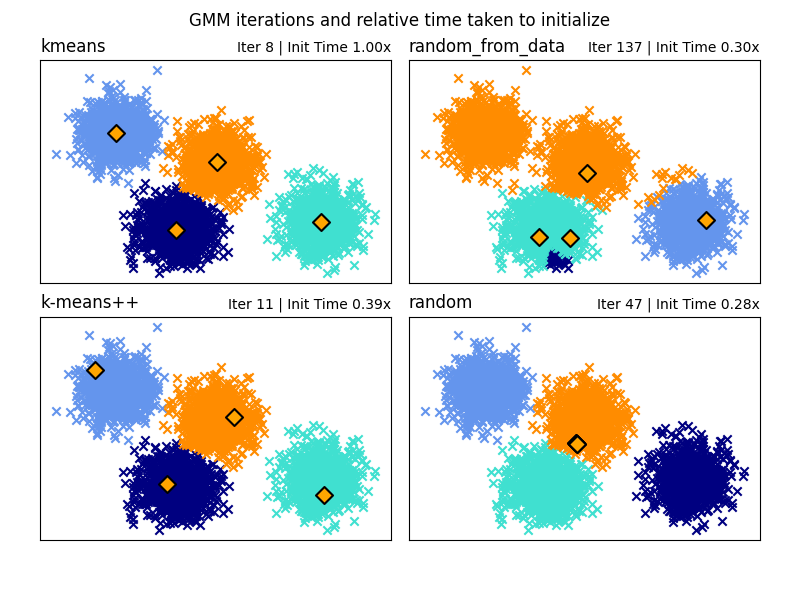
在这里,我们生成了一些具有四个易于识别的簇的样本数据。 此示例的目的是展示初始化参数 init_param 的四种不同方法。
这四种初始化方法是 kmeans*(默认)、*random、random_from_data 和 k-means++。
橙色菱形代表由 init_param 生成的 gmm 的初始化中心。其余数据表示为叉号,颜色表示 GMM 完成后的最终关联分类。
每个子图右上角的数字表示高斯混合模型收敛所需的迭代次数和算法运行初始化部分所需的相对时间。初始化时间较短的往往需要更多的迭代次数才能收敛。
初始化时间是该方法所需时间与默认 kmeans 方法所需时间的比率。如您所见,与 kmeans 相比,所有三种替代方法初始化所需时间都较少。
在此示例中,当使用 random_from_data 或 random 初始化时,模型需要更多的迭代次数才能收敛。这里 k-means++ 在初始化时间短和高斯混合模型迭代次数少方面表现良好。
# 作者: Gordon Walsh <gordon.p.walsh@gmail.com>
# 数据生成代码来自 Jake Vanderplas <vanderplas@astro.washington.edu>

from timeit import default_timer as timer

import matplotlib.pyplot as plt
import numpy as np

from sklearn.datasets._samples_generator import make_blobs
from sklearn.mixture import GaussianMixture
from sklearn.utils.extmath import row_norms

print(__doc__)

# 生成一些数据

X, y_true = make_blobs(n_samples=4000, centers=4, cluster_std=0.60, random_state=0)
X = X[ :, ::-1]

n_samples = 4000
n_components = 4
x_squared_norms = row_norms(X, squared=True)


def get_initial_means(X, init_params, r):
    # 运行一个 GaussianMixture 并设置 max_iter=0 以输出初始化均值
    gmm = GaussianMixture(
        n_components=4, init_params=init_params, tol=1e-9, max_iter=0, random_state=r
    ).fit(X)
    return gmm.means_


methods = ["kmeans", "random_from_data", "k-means++", "random"]
colors = ["navy", "turquoise", "cornflowerblue", "darkorange"]
times_init = {}
relative_times = {}

plt.figure(figsize=(4 * len(methods) // 2, 6))
plt.subplots_adjust(
    bottom=0.1, top=0.9, hspace=0.15, wspace=0.05, left=0.05, right=0.95
)

for n, method in enumerate(methods):
    r = np.random.RandomState(seed=1234)
    plt.subplot(2, len(methods) // 2, n + 1)

    start = timer()
    ini = get_initial_means(X, method, r)
    end = timer()
    init_time = end - start

    gmm = GaussianMixture(
        n_components=4, means_init=ini, tol=1e-9, max_iter=2000, random_state=r
    ).fit(X)

    times_init[method] = init_time
    for i, color in enumerate(colors):
        data = X[gmm.predict(X) == i]
        plt.scatter(data[:, 0], data[:, 1], color=color, marker="x")

    plt.scatter(
        ini[:, 0], ini[:, 1], s=75, marker="D", c="orange", lw=1.5, edgecolors="black"
    )
    relative_times[method] = times_init[method] / times_init[methods[0]]

    plt.xticks(())
    plt.yticks(())
    plt.title(method, loc="left", fontsize=12)
    plt.title(
        "Iter %i | Init Time %.2fx" % (gmm.n_iter_, relative_times[method]),
        loc="right",
        fontsize=10,
    )
plt.suptitle("GMM iterations and relative time taken to initialize")
plt.show()
Total running time of the script: (0 minutes 0.365 seconds)
Related examples

