Note
Go to the end to download the full example code. or to run this example in your browser via Binder
LDA和PCA在鸢尾花数据集上的二维投影比较#
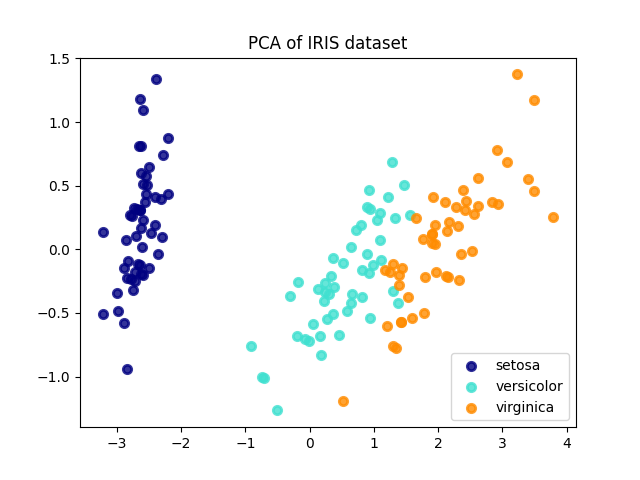
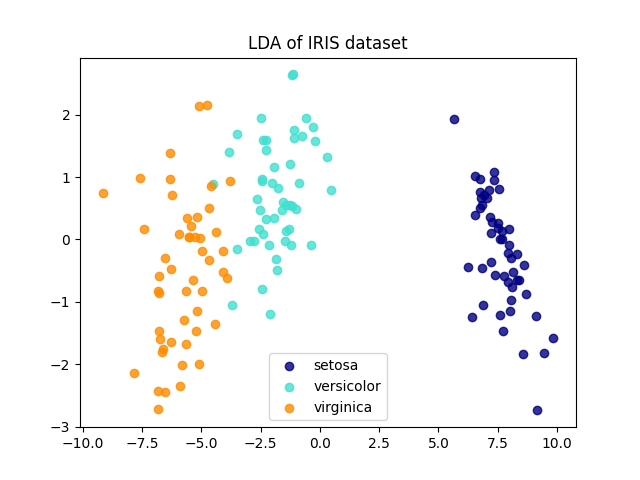
鸢尾花数据集代表了3种鸢尾花(山鸢尾、变色鸢尾和维吉尼亚鸢尾),包含4个属性:花萼长度、花萼宽度、花瓣长度和花瓣宽度。
主成分分析(PCA)应用于该数据集,识别出能够解释数据中最大方差的属性组合(主成分,或特征空间中的方向)。在这里,我们将不同的样本绘制在前两个主成分上。
线性判别分析(LDA)试图识别能够解释*类间*最大方差的属性。特别地,LDA与PCA不同,是一种有监督的方法,使用已知的类别标签。
explained variance ratio (first two components): [0.92461872 0.05306648]
import matplotlib.pyplot as plt

from sklearn import datasets
from sklearn.decomposition import PCA
from sklearn.discriminant_analysis import LinearDiscriminantAnalysis

iris = datasets.load_iris()

X = iris.data
y = iris.target
target_names = iris.target_names

pca = PCA(n_components=2)
X_r = pca.fit(X).transform(X)

lda = LinearDiscriminantAnalysis(n_components=2)
X_r2 = lda.fit(X, y).transform(X)

# 每个成分解释的方差百分比
print(
    "explained variance ratio (first two components): %s"
    % str(pca.explained_variance_ratio_)
)

plt.figure()
colors = ["navy", "turquoise", "darkorange"]
lw = 2

for color, i, target_name in zip(colors, [0, 1, 2], target_names):
    plt.scatter(
        X_r[y == i, 0], X_r[y == i, 1], color=color, alpha=0.8, lw=lw, label=target_name
    )
plt.legend(loc="best", shadow=False, scatterpoints=1)
plt.title("PCA of IRIS dataset")

plt.figure()
for color, i, target_name in zip(colors, [0, 1, 2], target_names):
    plt.scatter(
        X_r2[y == i, 0], X_r2[y == i, 1], alpha=0.8, color=color, label=target_name
    )
plt.legend(loc="best", shadow=False, scatterpoints=1)
plt.title("LDA of IRIS dataset")

plt.show()
Total running time of the script: (0 minutes 0.086 seconds)
Related examples

