Note
Go to the end to download the full example code. or to run this example in your browser via Binder
ROC 曲线与可视化 API#
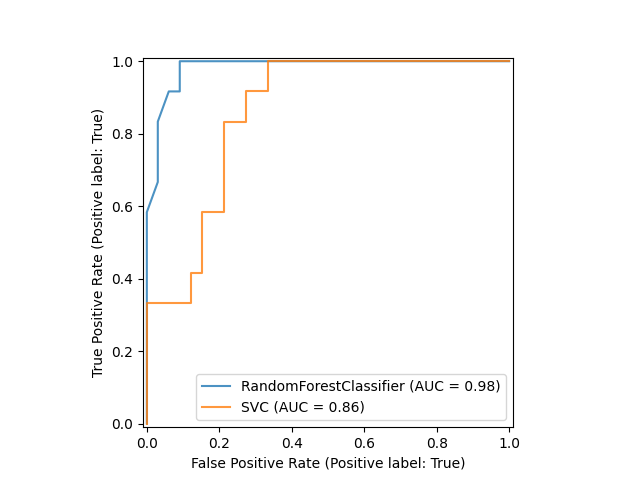
Scikit-learn 定义了一个用于创建机器学习可视化的简单 API。该 API 的主要特点是允许快速绘图和视觉调整,而无需重新计算。在本例中,我们将演示如何通过比较 ROC 曲线来使用可视化 API。
加载数据并训练支持向量分类器#
首先,我们加载葡萄酒数据集并将其转换为二分类问题。然后,我们在训练数据集上训练一个支持向量分类器。
import matplotlib.pyplot as plt

from sklearn.datasets import load_wine
from sklearn.ensemble import RandomForestClassifier
from sklearn.metrics import RocCurveDisplay
from sklearn.model_selection import train_test_split
from sklearn.svm import SVC

X, y = load_wine(return_X_y=True)
y = y == 2

X_train, X_test, y_train, y_test = train_test_split(X, y, random_state=42)
svc = SVC(random_state=42)
svc.fit(X_train, y_train)
绘制ROC曲线#
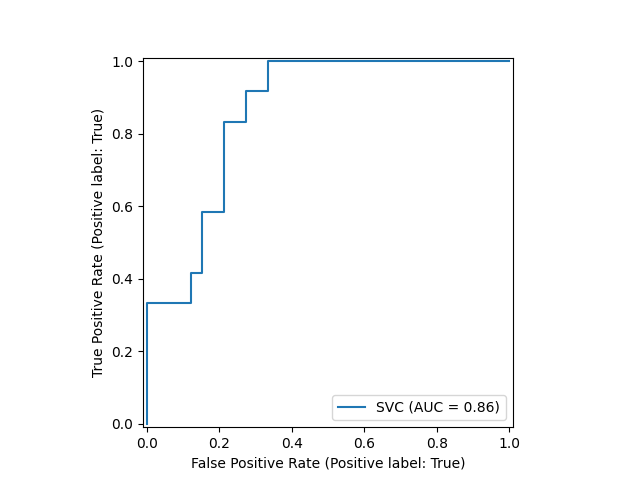
接下来,我们通过调用 sklearn.metrics.RocCurveDisplay.from_estimator 绘制ROC曲线。返回的 svc_disp 对象允许我们在未来的绘图中继续使用已经计算好的SVC的ROC曲线。
svc_disp = RocCurveDisplay.from_estimator(svc, X_test, y_test)
plt.show()
训练随机森林并绘制ROC曲线#
我们训练一个随机森林分类器,并创建一个图表将其与SVC的ROC曲线进行比较。注意, svc_disp 使用
plot 来绘制SVC的ROC曲线,而无需重新计算ROC曲线的值。此外,我们
在绘图函数中传递 alpha=0.8 来调整曲线的alpha值。
rfc = RandomForestClassifier(n_estimators=10, random_state=42)
rfc.fit(X_train, y_train)
ax = plt.gca()
rfc_disp = RocCurveDisplay.from_estimator(rfc, X_test, y_test, ax=ax, alpha=0.8)
svc_disp.plot(ax=ax, alpha=0.8)
plt.show()
Total running time of the script: (0 minutes 0.079 seconds)
Related examples

